| __timestamp | AECOM | AMETEK, Inc. |
|---|---|---|
| Wednesday, January 1, 2014 | 403176000 | 1424947000 |
| Thursday, January 1, 2015 | 535188000 | 1425015000 |
| Friday, January 1, 2016 | 642824000 | 1264867000 |
| Sunday, January 1, 2017 | 683720000 | 1448739000 |
| Monday, January 1, 2018 | 650649000 | 1659562000 |
| Tuesday, January 1, 2019 | 813445000 | 1787660000 |
| Wednesday, January 1, 2020 | 709560000 | 1543514000 |
| Friday, January 1, 2021 | 798421000 | 1912614000 |
| Saturday, January 1, 2022 | 847974000 | 2145269000 |
| Sunday, January 1, 2023 | 945465000 | 2384465001 |
| Monday, January 1, 2024 | 1084341000 | 6941180000 |
Unleashing insights
In the ever-evolving landscape of industrial and infrastructure sectors, AMETEK, Inc. and AECOM have emerged as key players. Over the past decade, AMETEK, Inc. has consistently outperformed AECOM in terms of gross profit, showcasing a robust growth trajectory. From 2014 to 2023, AMETEK, Inc.'s gross profit surged by approximately 67%, peaking in 2023. In contrast, AECOM's gross profit increased by about 135% during the same period, reflecting a significant upward trend, especially in recent years.
The data for 2024 is incomplete, indicating potential for further analysis. These trends highlight the dynamic nature of these industries and the strategic maneuvers by these companies to enhance profitability.
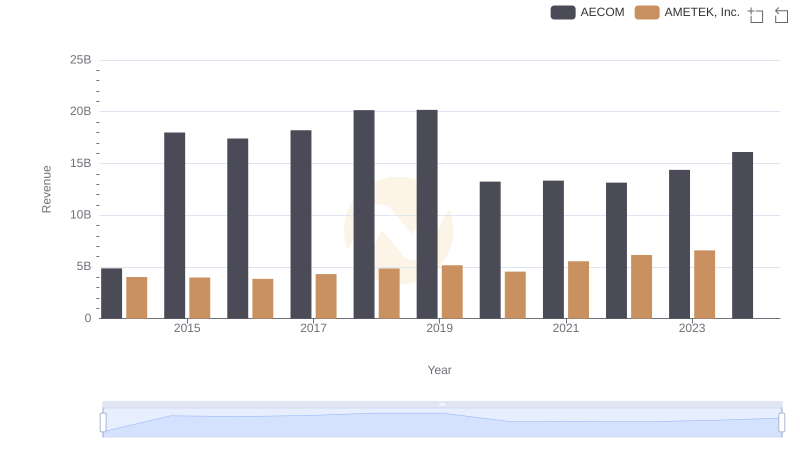
Who Generates More Revenue? AMETEK, Inc. or AECOM
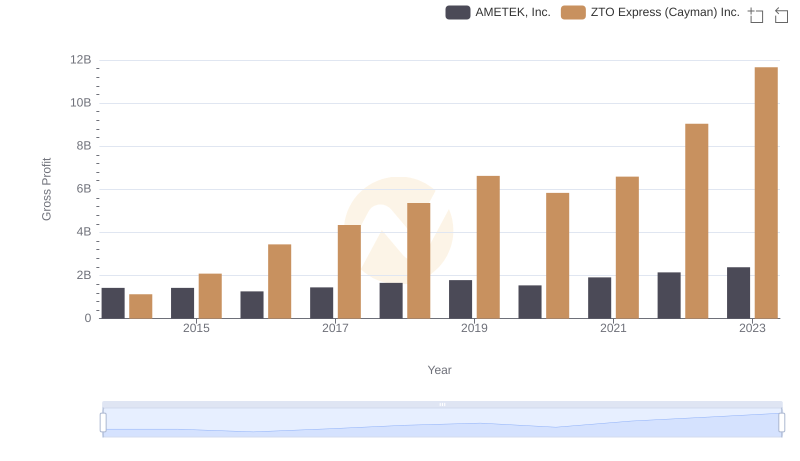
Gross Profit Comparison: AMETEK, Inc. and ZTO Express (Cayman) Inc. Trends
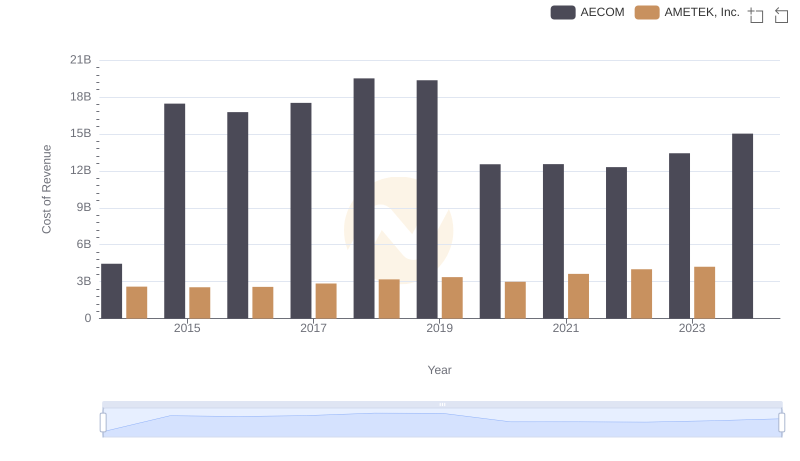
Cost of Revenue: Key Insights for AMETEK, Inc. and AECOM
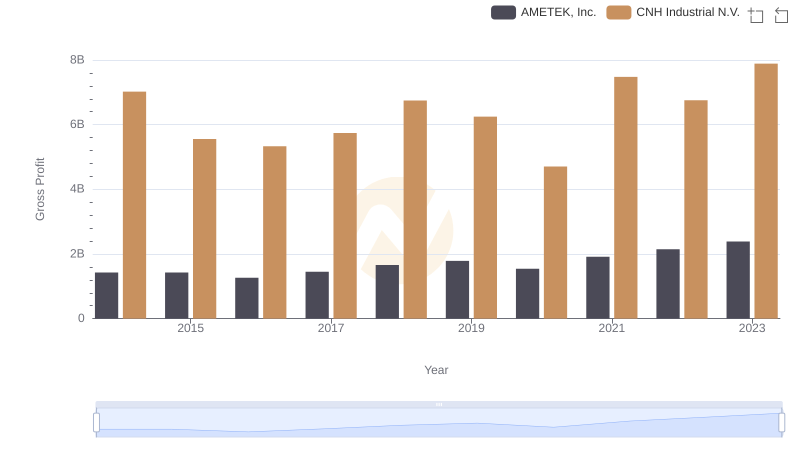
Gross Profit Trends Compared: AMETEK, Inc. vs CNH Industrial N.V.
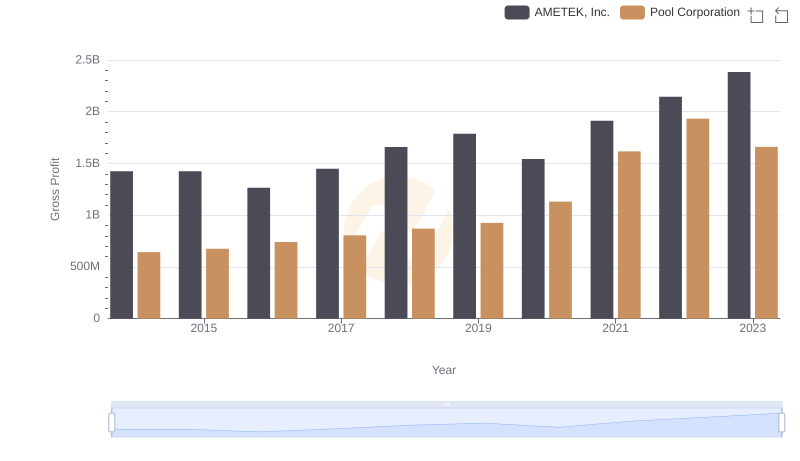
AMETEK, Inc. vs Pool Corporation: A Gross Profit Performance Breakdown
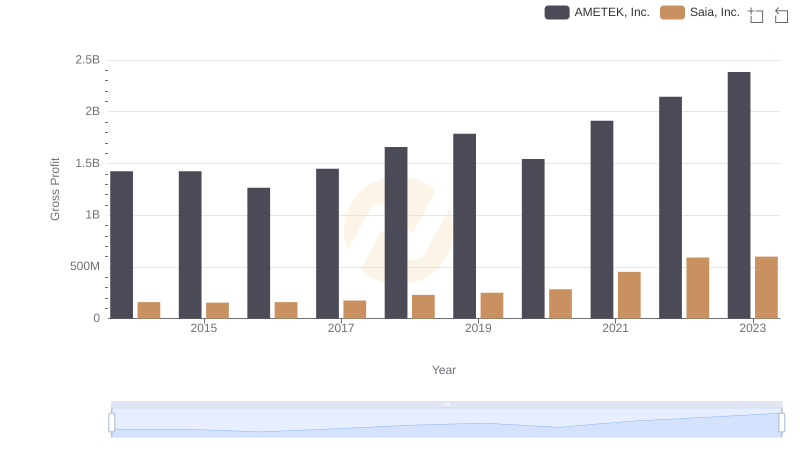
Gross Profit Trends Compared: AMETEK, Inc. vs Saia, Inc.
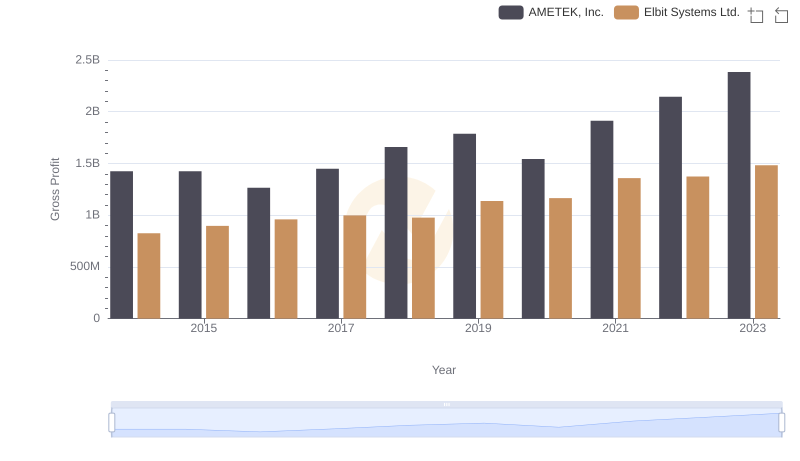
Key Insights on Gross Profit: AMETEK, Inc. vs Elbit Systems Ltd.
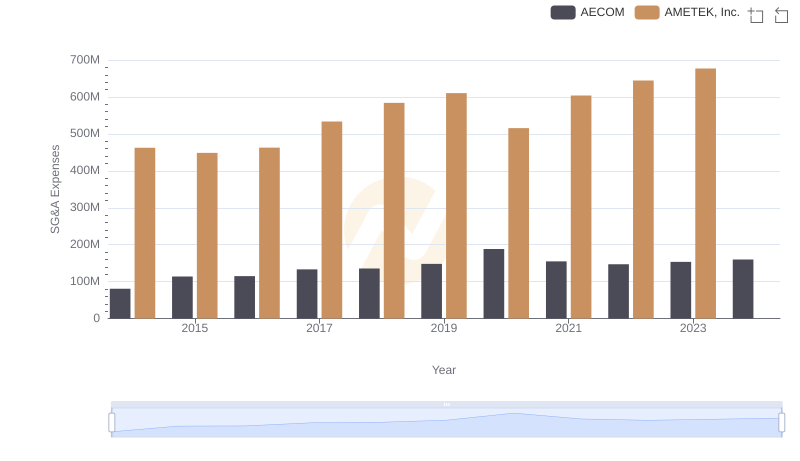
SG&A Efficiency Analysis: Comparing AMETEK, Inc. and AECOM
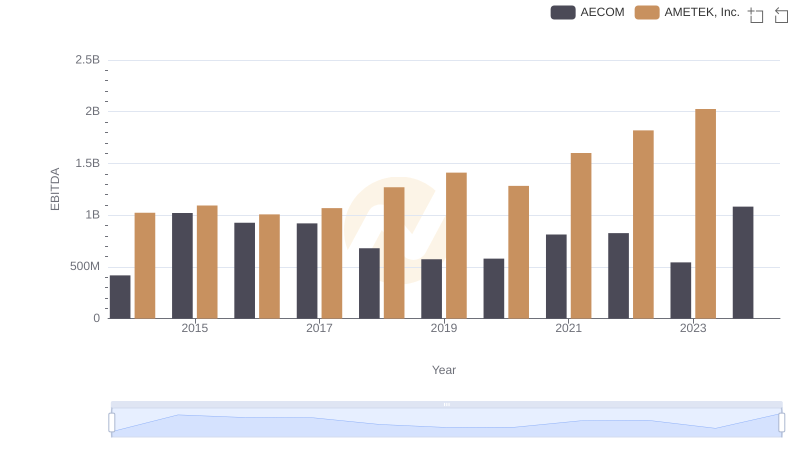
AMETEK, Inc. and AECOM: A Detailed Examination of EBITDA Performance