| __timestamp | Southwest Airlines Co. | Watsco, Inc. |
|---|---|---|
| Wednesday, January 1, 2014 | 14049000000 | 2988138000 |
| Thursday, January 1, 2015 | 13423000000 | 3105882000 |
| Friday, January 1, 2016 | 14151000000 | 3186118000 |
| Sunday, January 1, 2017 | 14968000000 | 3276296000 |
| Monday, January 1, 2018 | 15907000000 | 3426401000 |
| Tuesday, January 1, 2019 | 16445000000 | 3613406000 |
| Wednesday, January 1, 2020 | 10938000000 | 3832107000 |
| Friday, January 1, 2021 | 11675000000 | 4612647000 |
| Saturday, January 1, 2022 | 19062000000 | 5244055000 |
| Sunday, January 1, 2023 | 21868000000 | 5291627000 |
| Monday, January 1, 2024 | 23024000000 | 5573604000 |
Data in motion
In the ever-evolving landscape of American business, understanding the cost of revenue is crucial for evaluating a company's financial health. This analysis delves into the cost of revenue trends for Watsco, Inc. and Southwest Airlines Co. from 2014 to 2023. Over this period, Southwest Airlines experienced a significant 56% increase in its cost of revenue, peaking in 2023. This surge reflects the airline industry's challenges, including fluctuating fuel prices and operational costs. In contrast, Watsco, Inc., a leader in HVAC distribution, saw a steady 77% rise, highlighting its growth trajectory in the construction and home improvement sectors. The data reveals how these companies navigate their respective industries' economic landscapes, offering insights into their strategic financial management. As we move forward, these trends will be pivotal in shaping their competitive edge.
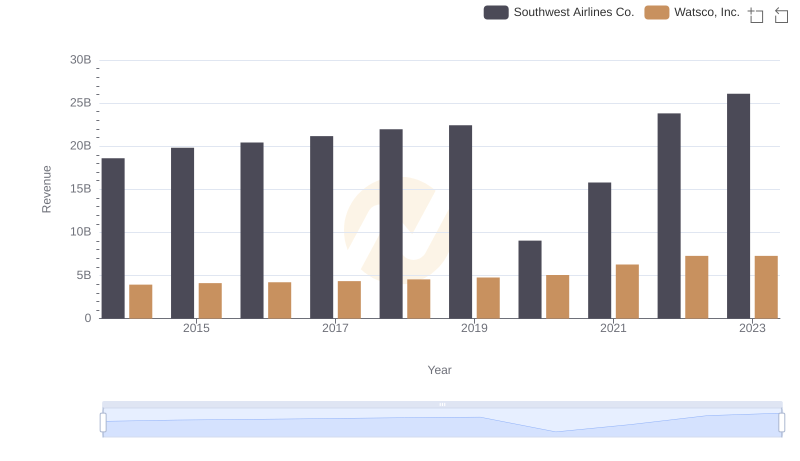
Watsco, Inc. vs Southwest Airlines Co.: Examining Key Revenue Metrics
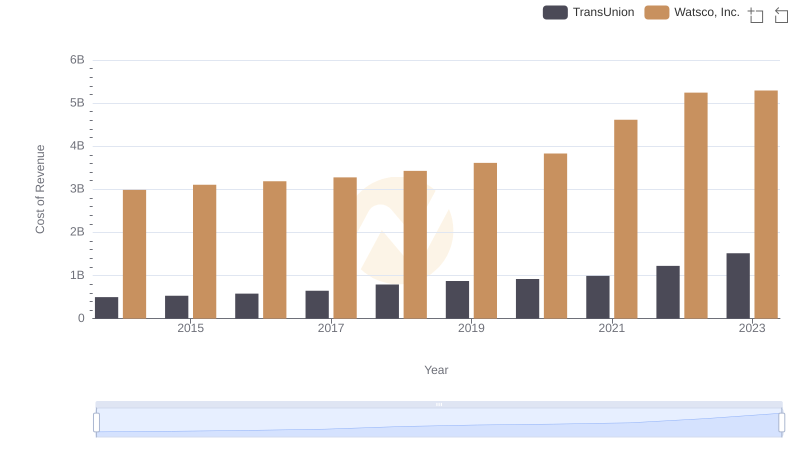
Cost Insights: Breaking Down Watsco, Inc. and TransUnion's Expenses
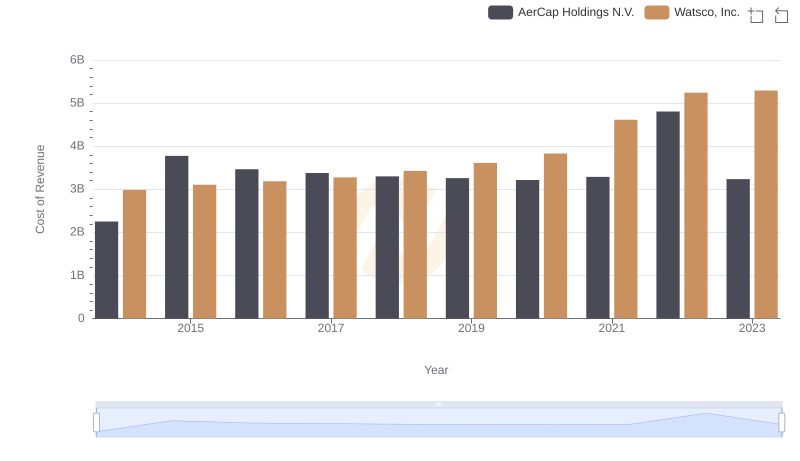
Cost of Revenue Comparison: Watsco, Inc. vs AerCap Holdings N.V.
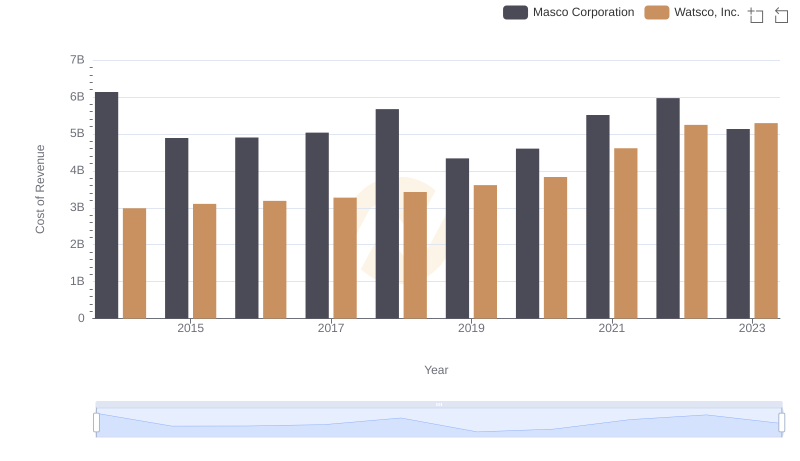
Watsco, Inc. vs Masco Corporation: Efficiency in Cost of Revenue Explored
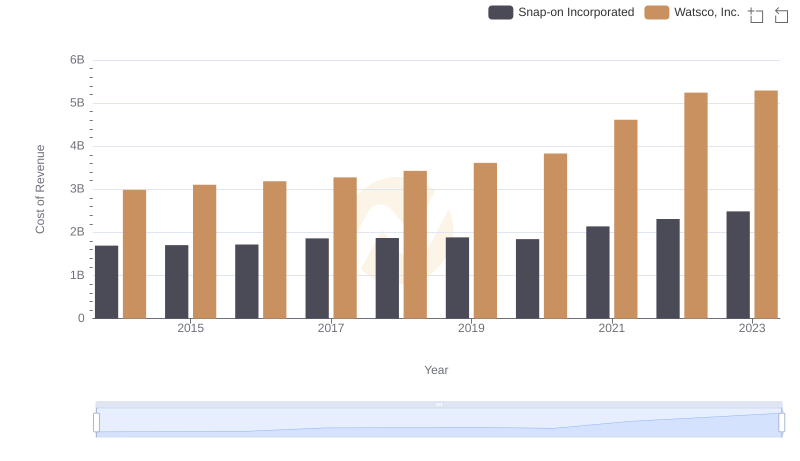
Cost Insights: Breaking Down Watsco, Inc. and Snap-on Incorporated's Expenses
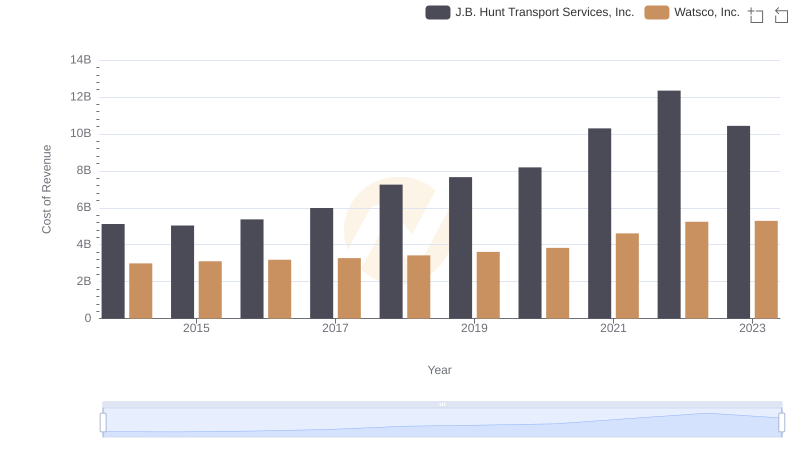
Cost Insights: Breaking Down Watsco, Inc. and J.B. Hunt Transport Services, Inc.'s Expenses
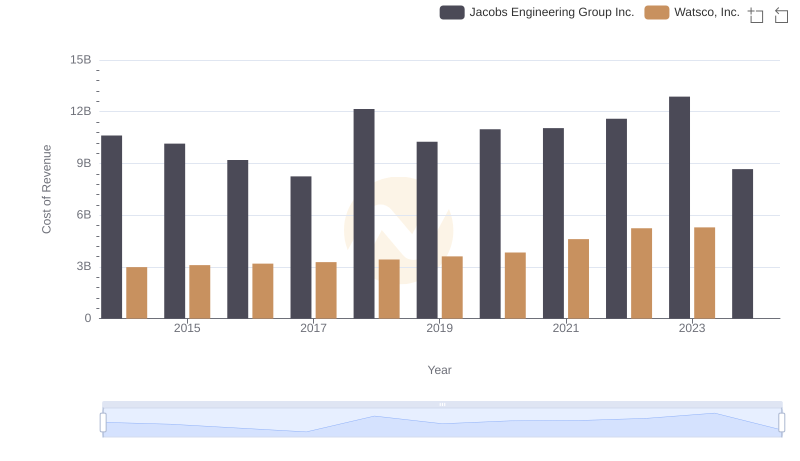
Cost of Revenue: Key Insights for Watsco, Inc. and Jacobs Engineering Group Inc.
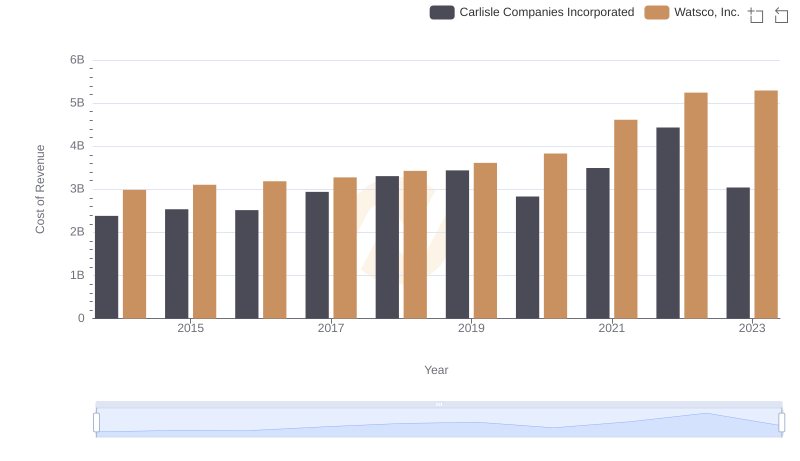
Cost Insights: Breaking Down Watsco, Inc. and Carlisle Companies Incorporated's Expenses
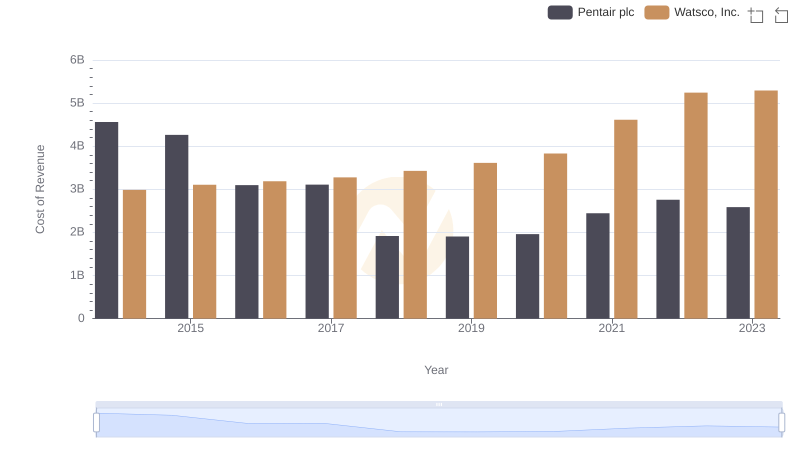
Cost of Revenue Trends: Watsco, Inc. vs Pentair plc