| __timestamp | Trane Technologies plc | TransUnion |
|---|---|---|
| Wednesday, January 1, 2014 | 12891400000 | 1304700000 |
| Thursday, January 1, 2015 | 13300700000 | 1506800000 |
| Friday, January 1, 2016 | 13508900000 | 1704900000 |
| Sunday, January 1, 2017 | 14197600000 | 1933800000 |
| Monday, January 1, 2018 | 15668200000 | 2317200000 |
| Tuesday, January 1, 2019 | 16598900000 | 2656100000 |
| Wednesday, January 1, 2020 | 12454700000 | 2716600000 |
| Friday, January 1, 2021 | 14136400000 | 2960200000 |
| Saturday, January 1, 2022 | 15991700000 | 3709900000 |
| Sunday, January 1, 2023 | 17677600000 | 3831200000 |
| Monday, January 1, 2024 | 19838200000 | 4183800000 |
Unleashing insights
In the ever-evolving landscape of global business, understanding revenue trends is crucial. Trane Technologies plc and TransUnion, two giants in their respective industries, have shown remarkable growth over the past decade. From 2014 to 2023, Trane Technologies plc's revenue surged by approximately 37%, reflecting its robust market strategies and innovation. Meanwhile, TransUnion, a leader in credit reporting, experienced a staggering 193% increase in revenue, highlighting its expanding influence in the financial sector.
These insights provide a window into the strategic maneuvers and market dynamics that have shaped these companies' trajectories.
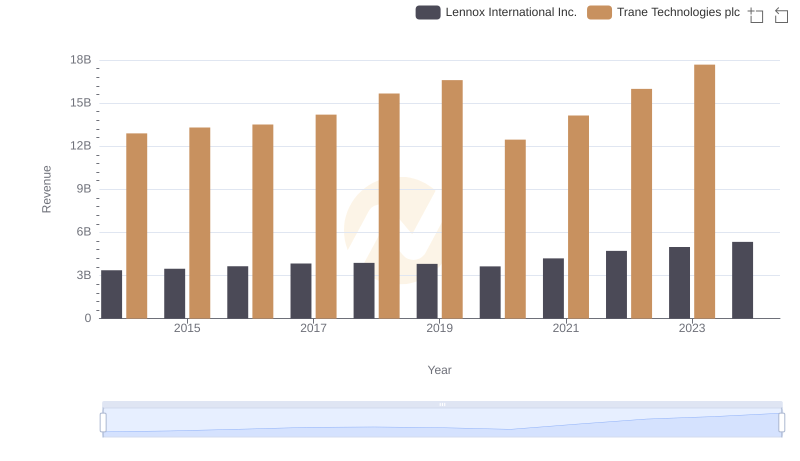
Trane Technologies plc vs Lennox International Inc.: Examining Key Revenue Metrics
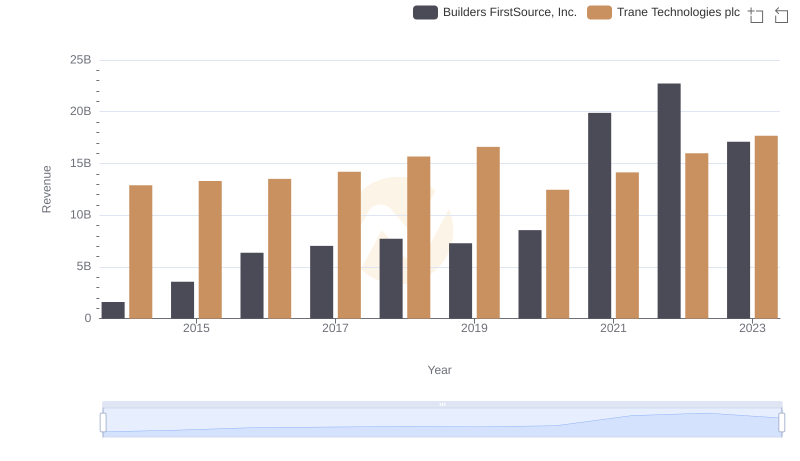
Trane Technologies plc vs Builders FirstSource, Inc.: Examining Key Revenue Metrics

Breaking Down Revenue Trends: Trane Technologies plc vs Hubbell Incorporated
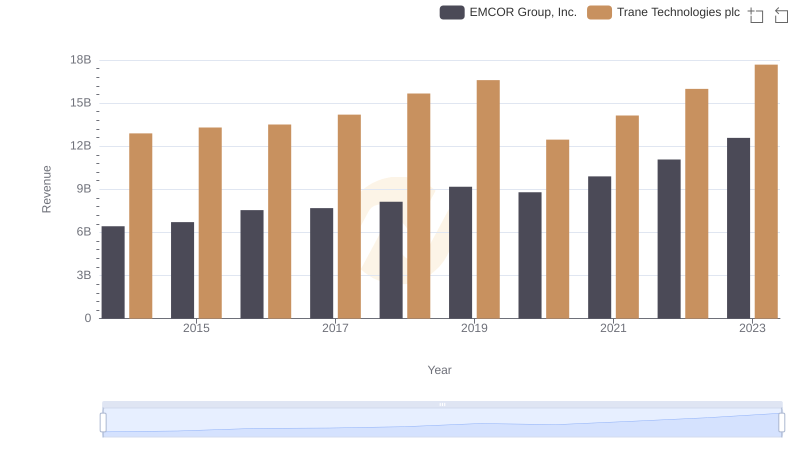
Trane Technologies plc and EMCOR Group, Inc.: A Comprehensive Revenue Analysis
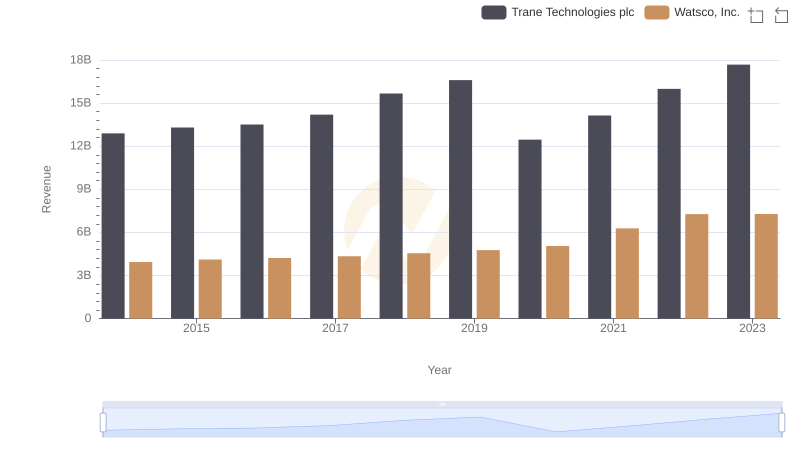
Trane Technologies plc or Watsco, Inc.: Who Leads in Yearly Revenue?
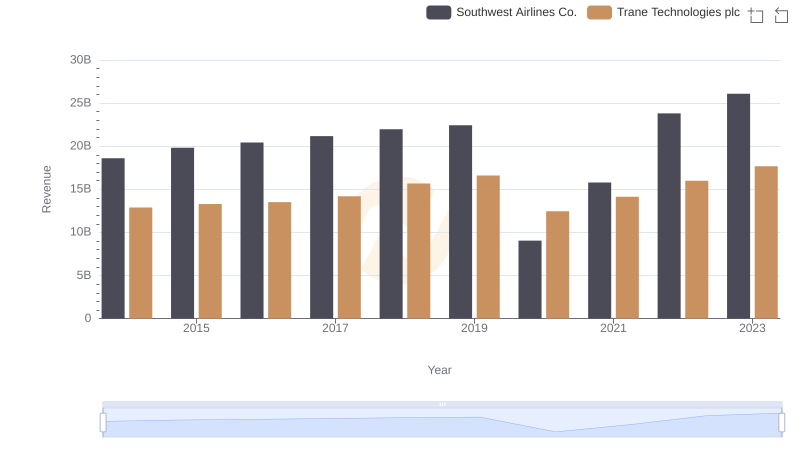
Comparing Revenue Performance: Trane Technologies plc or Southwest Airlines Co.?
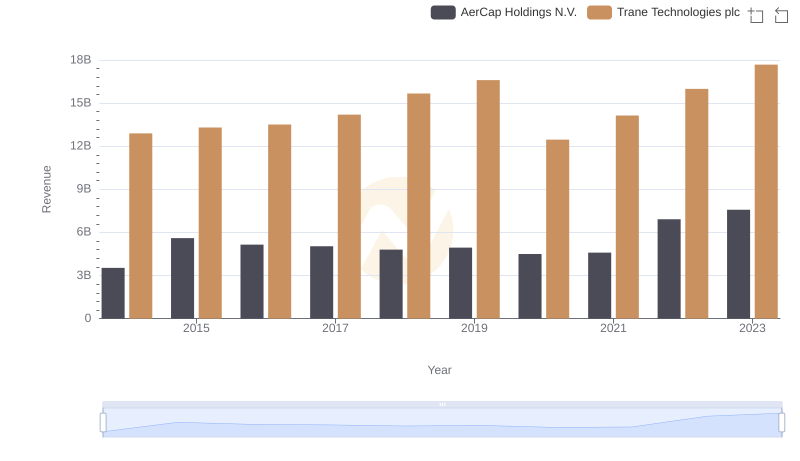
Revenue Insights: Trane Technologies plc and AerCap Holdings N.V. Performance Compared
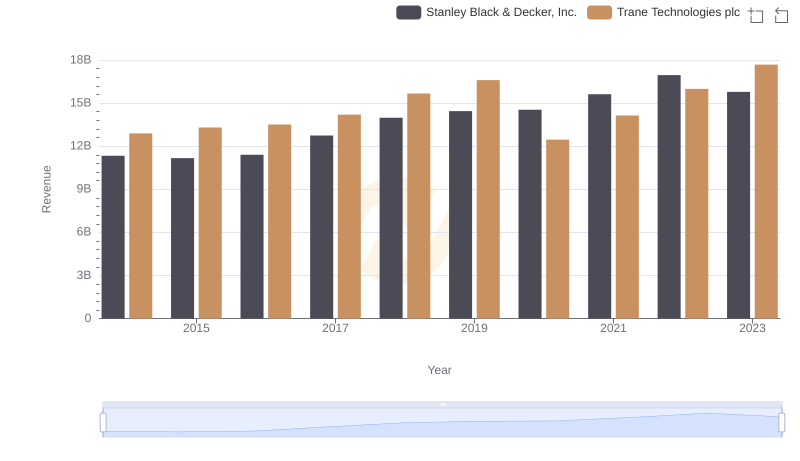
Trane Technologies plc or Stanley Black & Decker, Inc.: Who Leads in Yearly Revenue?
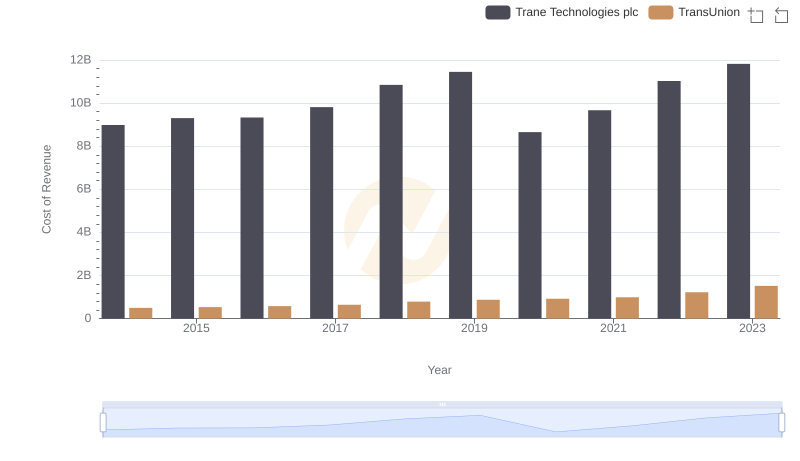
Cost of Revenue Comparison: Trane Technologies plc vs TransUnion
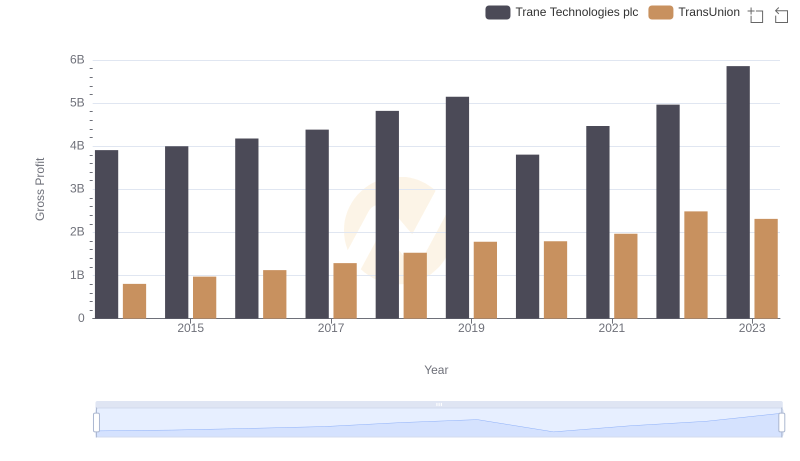
Who Generates Higher Gross Profit? Trane Technologies plc or TransUnion
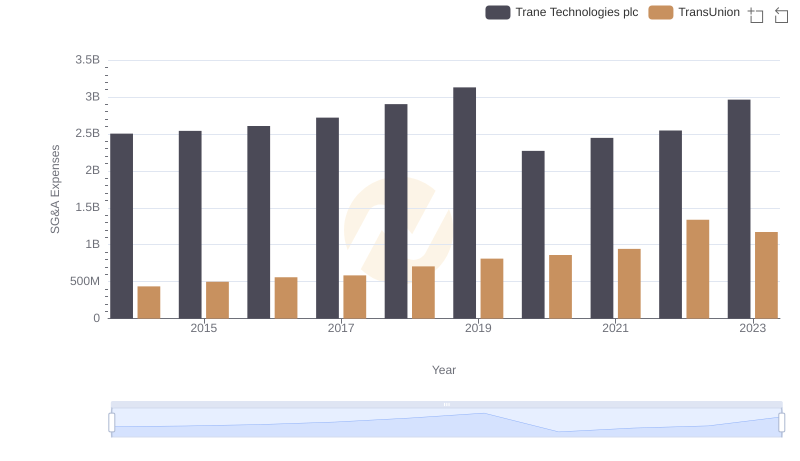
Breaking Down SG&A Expenses: Trane Technologies plc vs TransUnion

Trane Technologies plc vs TransUnion: In-Depth EBITDA Performance Comparison