| __timestamp | Trane Technologies plc | TransUnion |
|---|---|---|
| Wednesday, January 1, 2014 | 2503900000 | 436000000 |
| Thursday, January 1, 2015 | 2541100000 | 499700000 |
| Friday, January 1, 2016 | 2606500000 | 560100000 |
| Sunday, January 1, 2017 | 2720700000 | 585400000 |
| Monday, January 1, 2018 | 2903200000 | 707700000 |
| Tuesday, January 1, 2019 | 3129800000 | 812100000 |
| Wednesday, January 1, 2020 | 2270600000 | 860300000 |
| Friday, January 1, 2021 | 2446300000 | 943900000 |
| Saturday, January 1, 2022 | 2545900000 | 1337400000 |
| Sunday, January 1, 2023 | 2963200000 | 1171600000 |
| Monday, January 1, 2024 | 3580400000 | 1239300000 |
Unleashing insights
In the ever-evolving landscape of corporate finance, understanding the nuances of Selling, General, and Administrative (SG&A) expenses is crucial. Over the past decade, Trane Technologies plc and TransUnion have showcased distinct trajectories in their SG&A expenditures. From 2014 to 2023, Trane Technologies consistently outpaced TransUnion, with its expenses peaking at approximately 3 billion USD in 2019, a 25% increase from 2014. In contrast, TransUnion's SG&A expenses grew by nearly 170% over the same period, reaching their zenith in 2022. This divergence highlights Trane's steady operational scale and TransUnion's aggressive expansion strategy. The data underscores the importance of strategic financial management in maintaining competitive advantage. As businesses navigate the complexities of the modern market, these insights offer a window into the financial strategies that drive success.
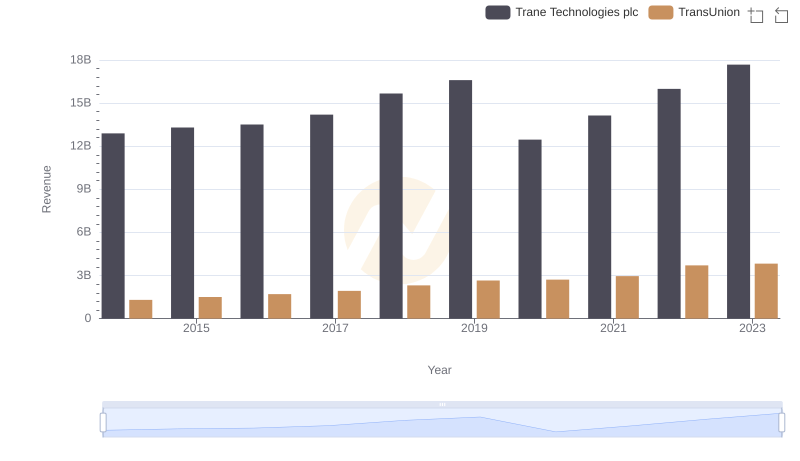
Revenue Insights: Trane Technologies plc and TransUnion Performance Compared
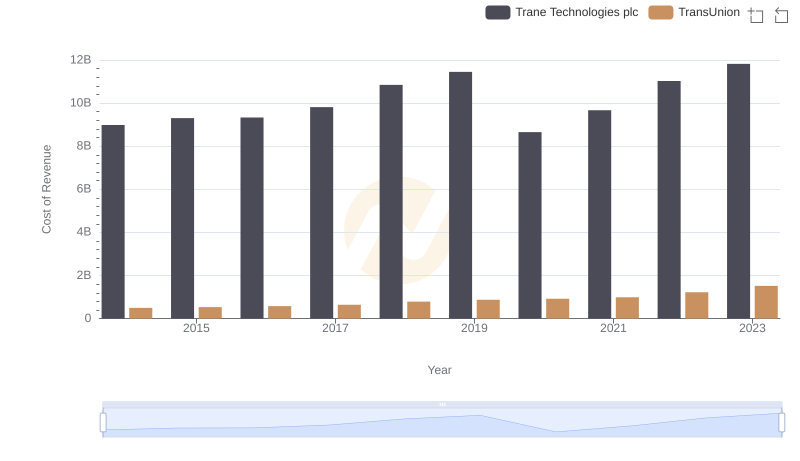
Cost of Revenue Comparison: Trane Technologies plc vs TransUnion
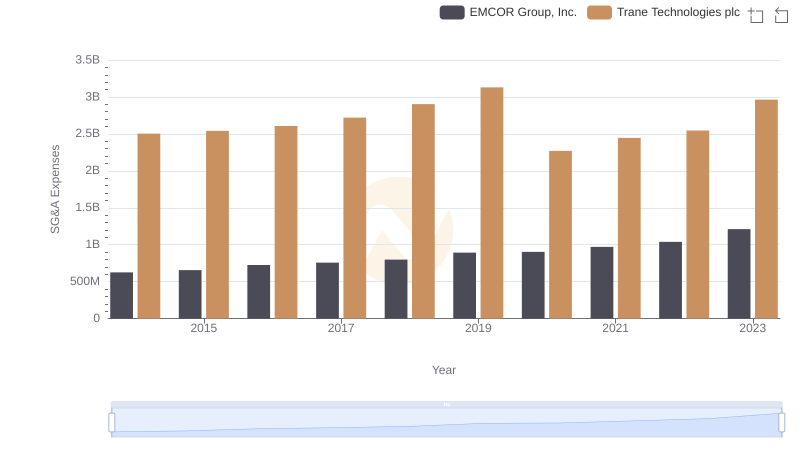
Trane Technologies plc vs EMCOR Group, Inc.: SG&A Expense Trends
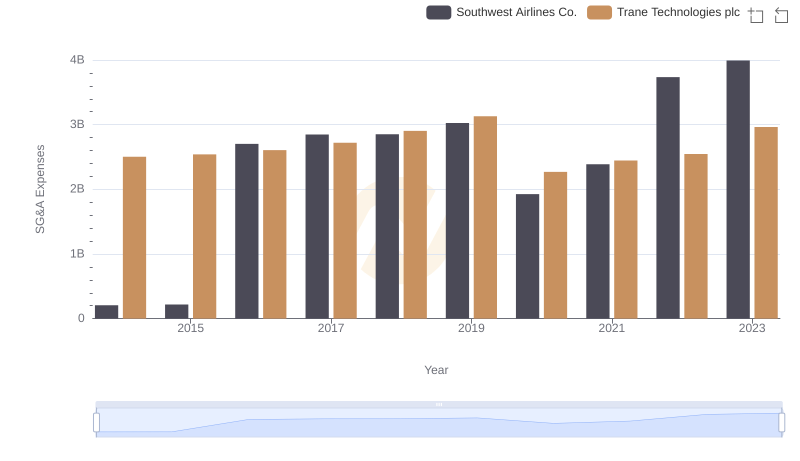
Operational Costs Compared: SG&A Analysis of Trane Technologies plc and Southwest Airlines Co.

Cost Management Insights: SG&A Expenses for Trane Technologies plc and Builders FirstSource, Inc.
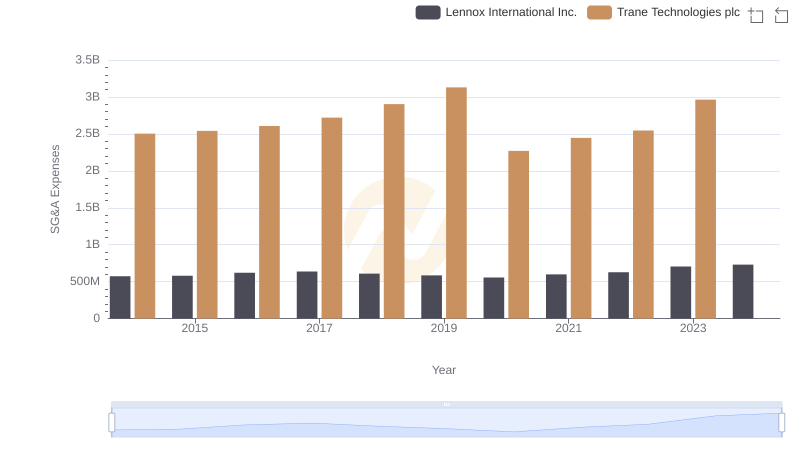
Selling, General, and Administrative Costs: Trane Technologies plc vs Lennox International Inc.
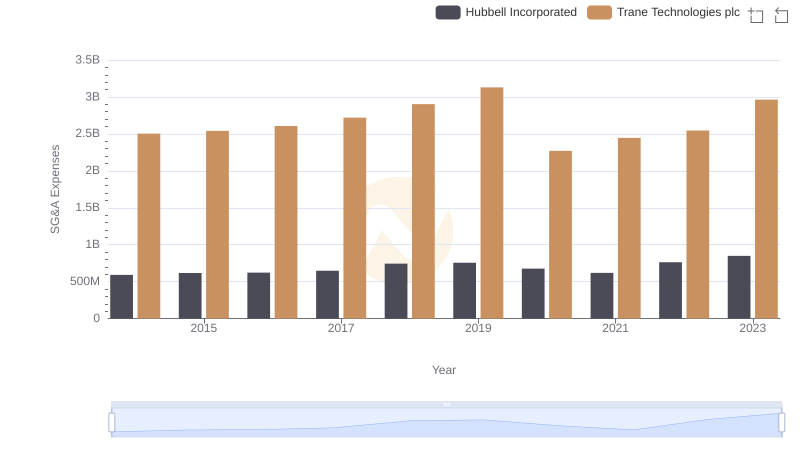
SG&A Efficiency Analysis: Comparing Trane Technologies plc and Hubbell Incorporated
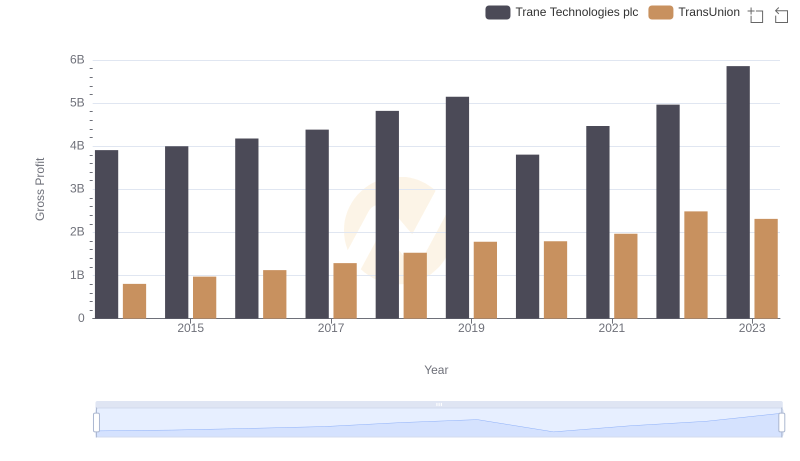
Who Generates Higher Gross Profit? Trane Technologies plc or TransUnion

Cost Management Insights: SG&A Expenses for Trane Technologies plc and Watsco, Inc.

Trane Technologies plc vs TransUnion: In-Depth EBITDA Performance Comparison
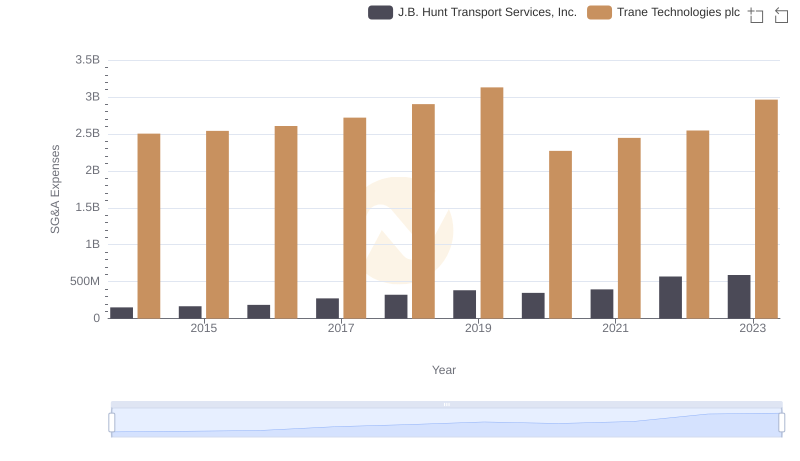
Trane Technologies plc or J.B. Hunt Transport Services, Inc.: Who Manages SG&A Costs Better?