| __timestamp | Roper Technologies, Inc. | Trane Technologies plc |
|---|---|---|
| Wednesday, January 1, 2014 | 3549494000 | 12891400000 |
| Thursday, January 1, 2015 | 3582395000 | 13300700000 |
| Friday, January 1, 2016 | 3789925000 | 13508900000 |
| Sunday, January 1, 2017 | 4607471000 | 14197600000 |
| Monday, January 1, 2018 | 5191200000 | 15668200000 |
| Tuesday, January 1, 2019 | 5366800000 | 16598900000 |
| Wednesday, January 1, 2020 | 5527100000 | 12454700000 |
| Friday, January 1, 2021 | 5777800000 | 14136400000 |
| Saturday, January 1, 2022 | 5371800000 | 15991700000 |
| Sunday, January 1, 2023 | 6177800000 | 17677600000 |
| Monday, January 1, 2024 | 7039200000 | 19838200000 |
Igniting the spark of knowledge
In the ever-evolving landscape of industrial innovation, Trane Technologies plc and Roper Technologies, Inc. stand as formidable players. Over the past decade, these companies have showcased remarkable revenue trajectories, reflecting their strategic prowess and market adaptability. From 2014 to 2023, Trane Technologies consistently outpaced Roper Technologies, with revenues peaking at approximately $17.7 billion in 2023, marking a 37% increase from 2014. Meanwhile, Roper Technologies demonstrated steady growth, achieving a 74% rise in revenue, culminating in $6.2 billion in 2023.
This comparative analysis highlights the dynamic nature of industrial giants and their ability to navigate challenges while seizing opportunities.
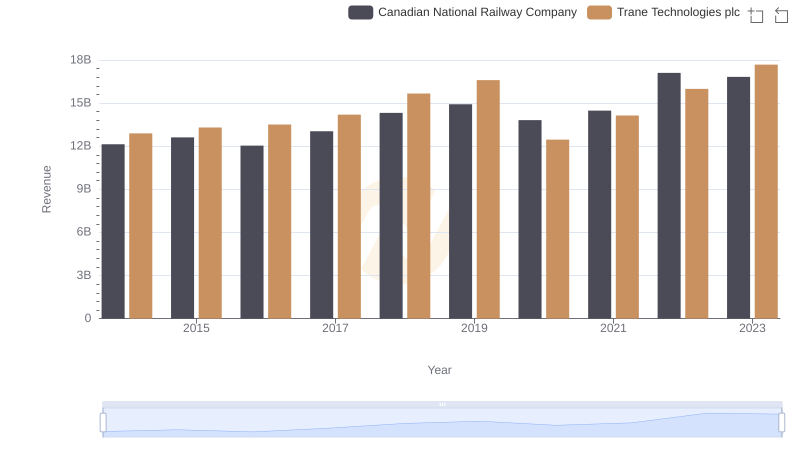
Trane Technologies plc and Canadian National Railway Company: A Comprehensive Revenue Analysis
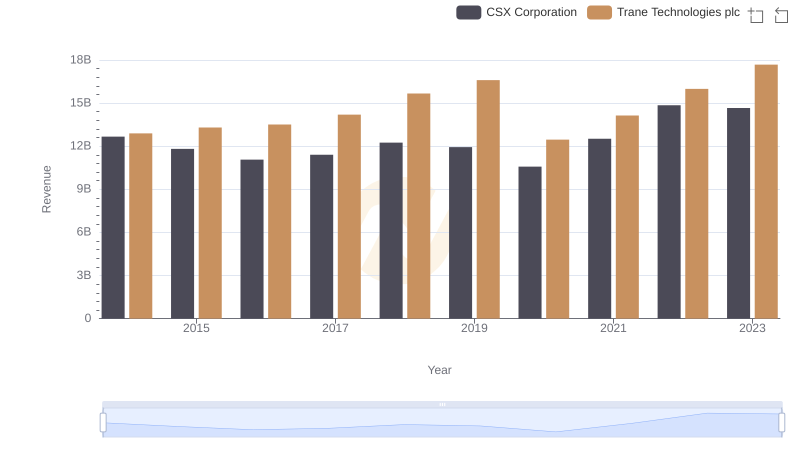
Breaking Down Revenue Trends: Trane Technologies plc vs CSX Corporation
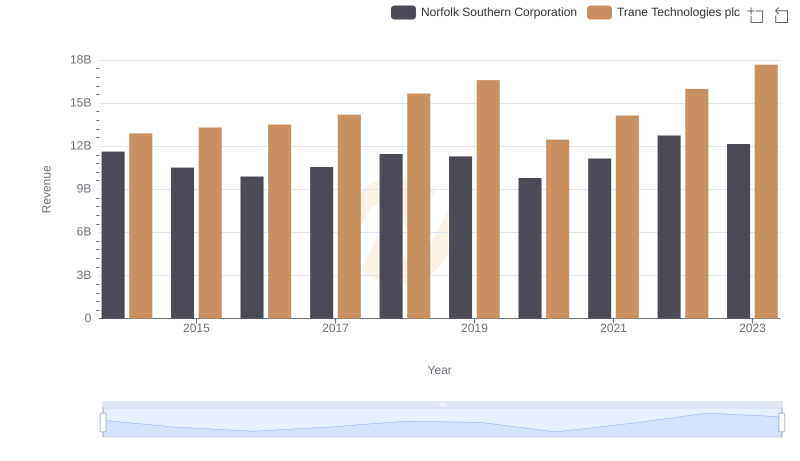
Trane Technologies plc and Norfolk Southern Corporation: A Comprehensive Revenue Analysis

Revenue Insights: Trane Technologies plc and PACCAR Inc Performance Compared
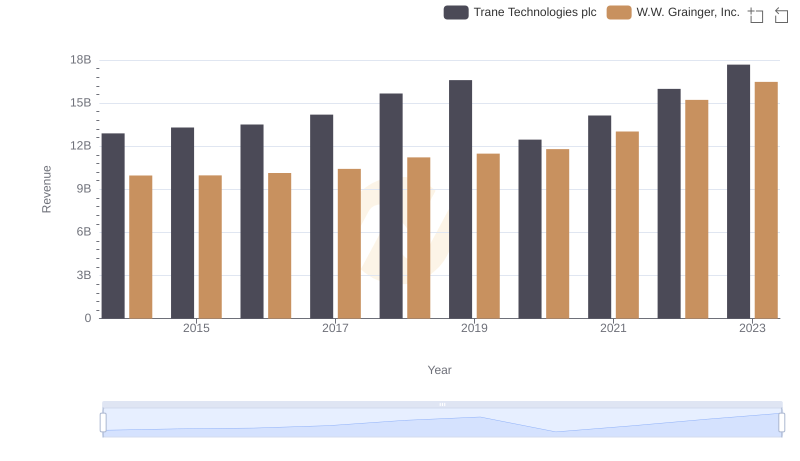
Annual Revenue Comparison: Trane Technologies plc vs W.W. Grainger, Inc.
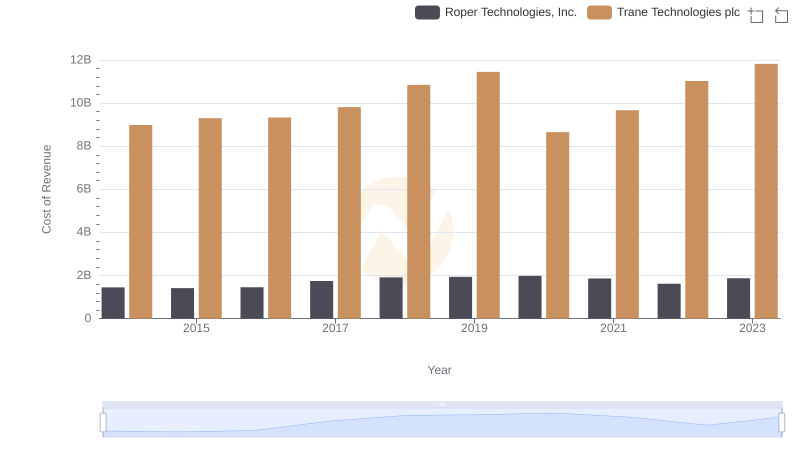
Cost of Revenue Comparison: Trane Technologies plc vs Roper Technologies, Inc.
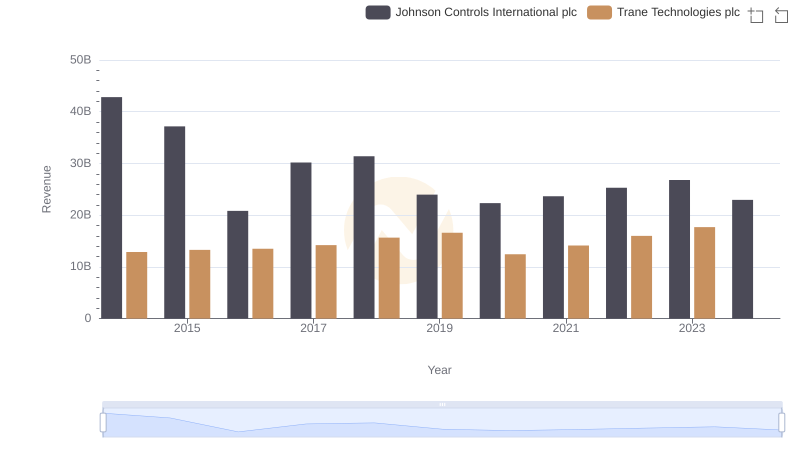
Revenue Insights: Trane Technologies plc and Johnson Controls International plc Performance Compared
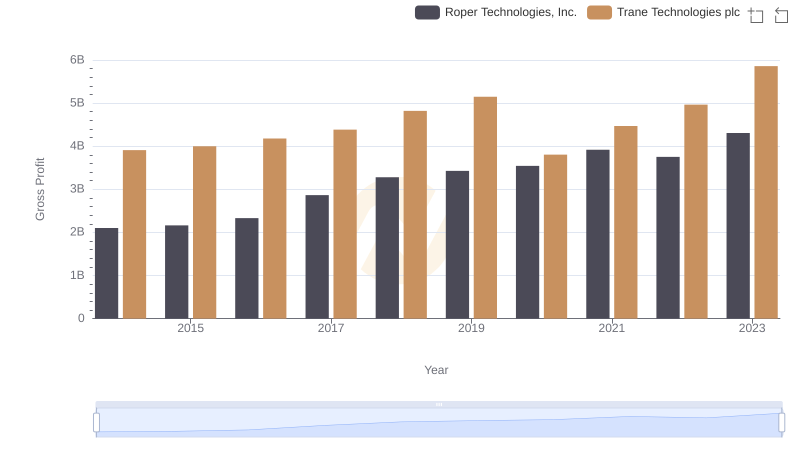
Trane Technologies plc vs Roper Technologies, Inc.: A Gross Profit Performance Breakdown
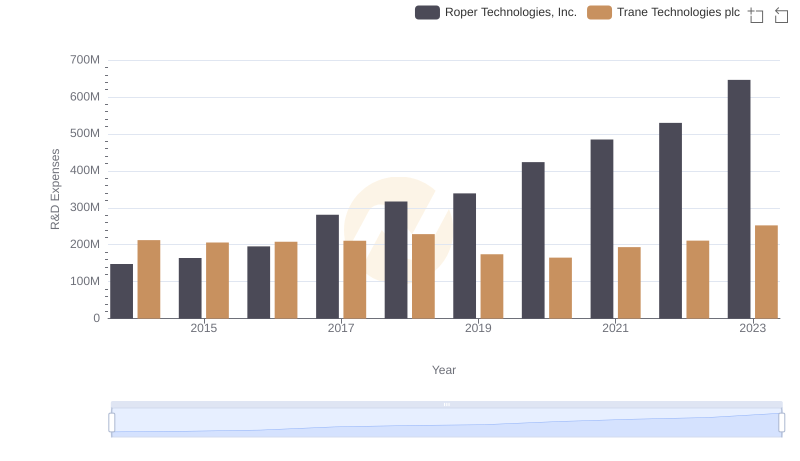
Trane Technologies plc or Roper Technologies, Inc.: Who Invests More in Innovation?
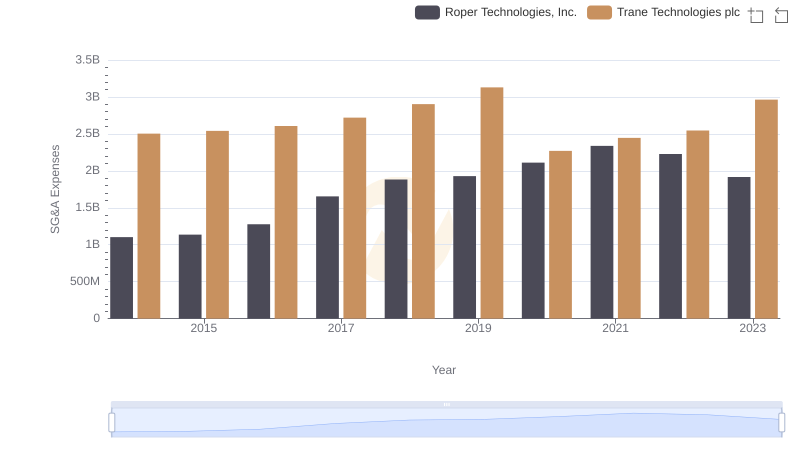
Trane Technologies plc or Roper Technologies, Inc.: Who Manages SG&A Costs Better?
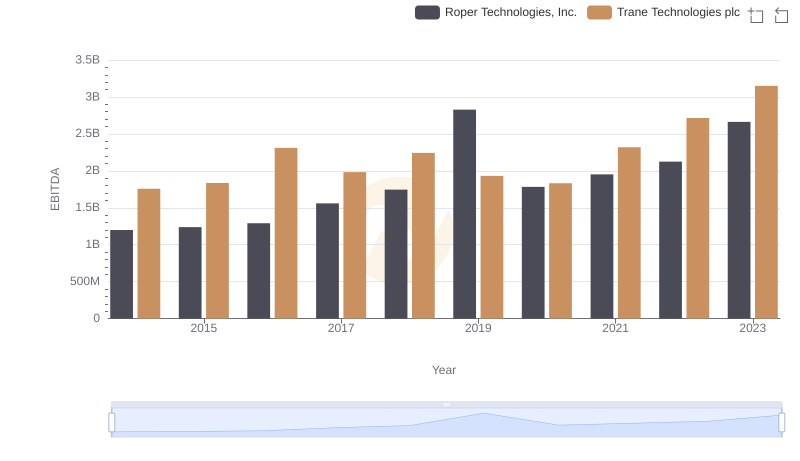
A Side-by-Side Analysis of EBITDA: Trane Technologies plc and Roper Technologies, Inc.