| __timestamp | Roper Technologies, Inc. | Trane Technologies plc |
|---|---|---|
| Wednesday, January 1, 2014 | 1199557000 | 1757000000 |
| Thursday, January 1, 2015 | 1238079000 | 1835000000 |
| Friday, January 1, 2016 | 1290510000 | 2311000000 |
| Sunday, January 1, 2017 | 1558802000 | 1982500000 |
| Monday, January 1, 2018 | 1746500000 | 2242400000 |
| Tuesday, January 1, 2019 | 2827900000 | 1931200000 |
| Wednesday, January 1, 2020 | 1782800000 | 1831900000 |
| Friday, January 1, 2021 | 1951500000 | 2319200000 |
| Saturday, January 1, 2022 | 2124500000 | 2715500000 |
| Sunday, January 1, 2023 | 2663000000 | 3149900000 |
| Monday, January 1, 2024 | 1996800000 | 3859600000 |
Igniting the spark of knowledge
In the ever-evolving landscape of industrial technology, understanding financial performance is crucial. This analysis delves into the EBITDA trends of Trane Technologies plc and Roper Technologies, Inc. from 2014 to 2023. Over this period, Trane Technologies demonstrated a robust growth trajectory, with EBITDA increasing by approximately 79%, peaking at $3.15 billion in 2023. In contrast, Roper Technologies experienced a more moderate growth of around 122%, reaching $2.66 billion in the same year.
The data reveals that while both companies have shown resilience, Trane Technologies consistently outperformed Roper Technologies in terms of EBITDA, except in 2019 when Roper surged ahead. This financial insight underscores the dynamic nature of the industrial sector and highlights the strategic maneuvers each company has employed to navigate market challenges and opportunities over the past decade.
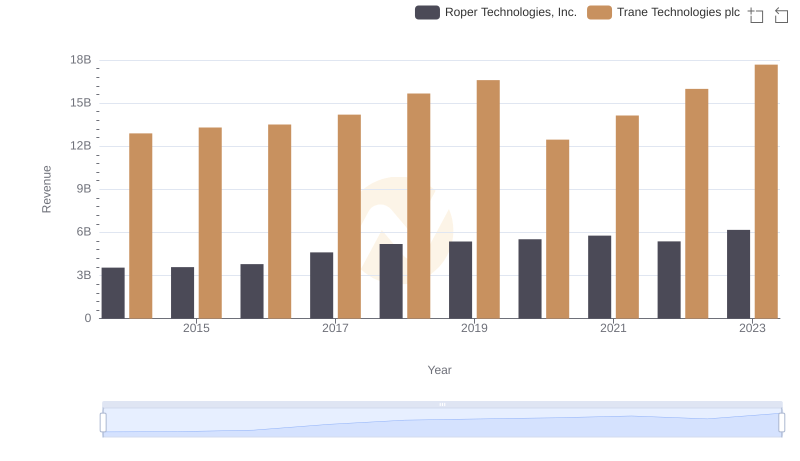
Trane Technologies plc vs Roper Technologies, Inc.: Examining Key Revenue Metrics
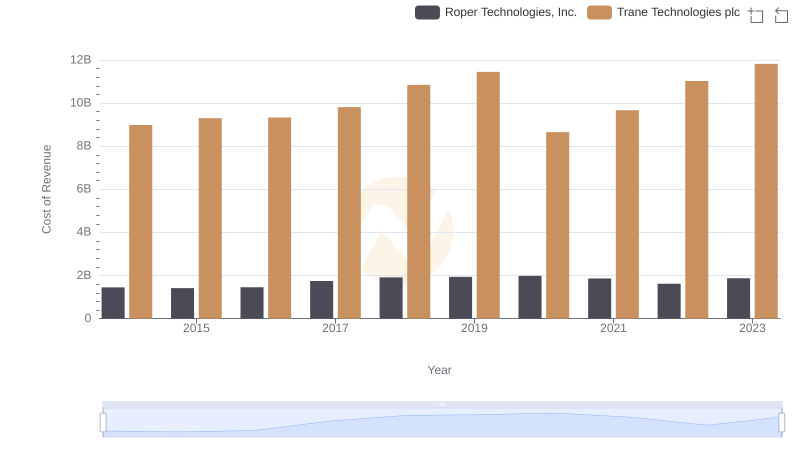
Cost of Revenue Comparison: Trane Technologies plc vs Roper Technologies, Inc.
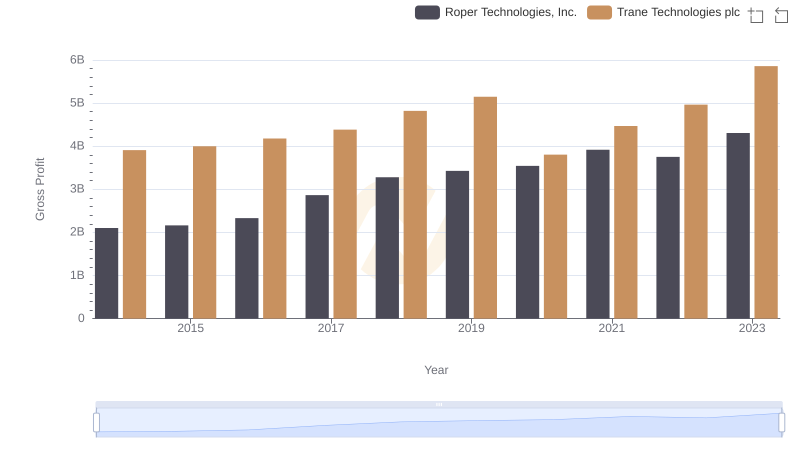
Trane Technologies plc vs Roper Technologies, Inc.: A Gross Profit Performance Breakdown
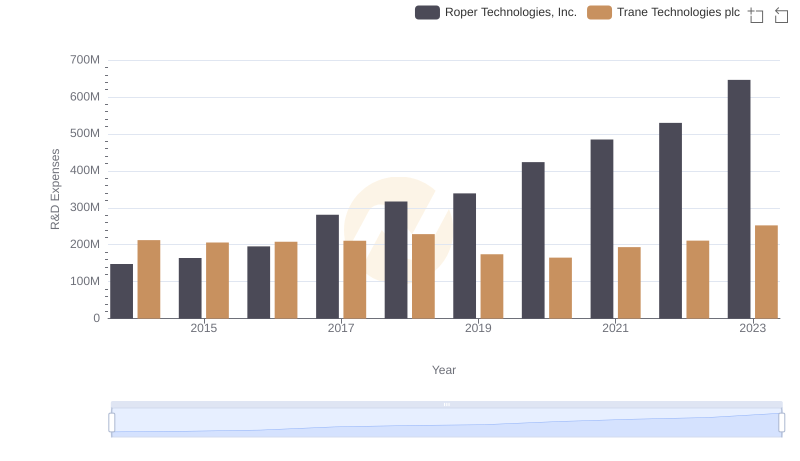
Trane Technologies plc or Roper Technologies, Inc.: Who Invests More in Innovation?
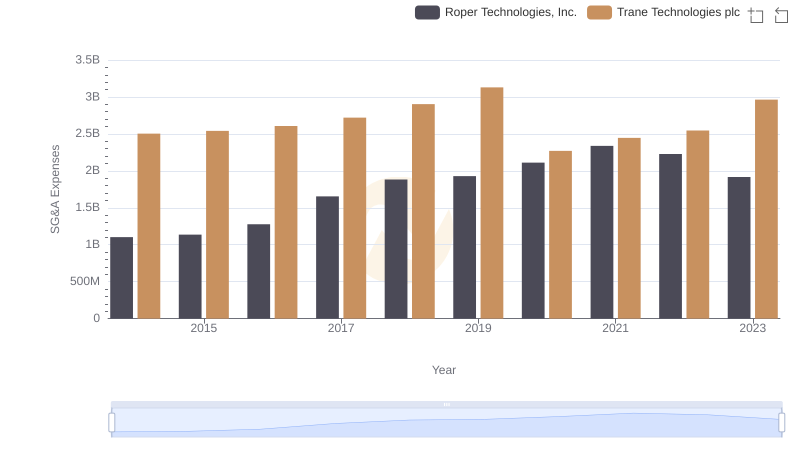
Trane Technologies plc or Roper Technologies, Inc.: Who Manages SG&A Costs Better?
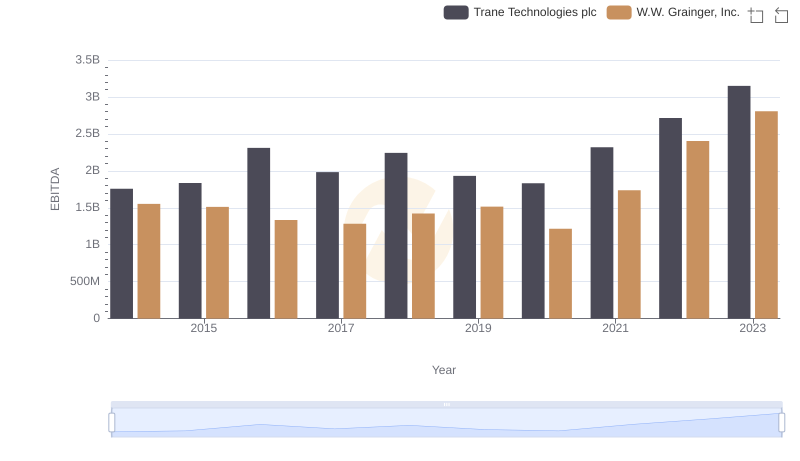
EBITDA Metrics Evaluated: Trane Technologies plc vs W.W. Grainger, Inc.
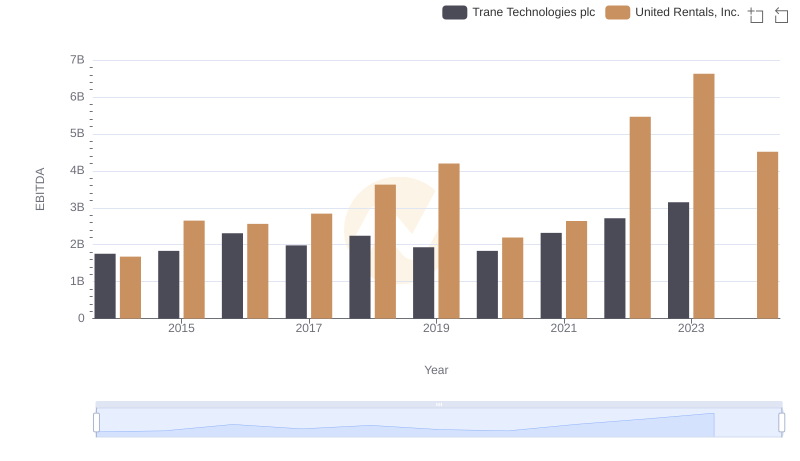
Comparative EBITDA Analysis: Trane Technologies plc vs United Rentals, Inc.
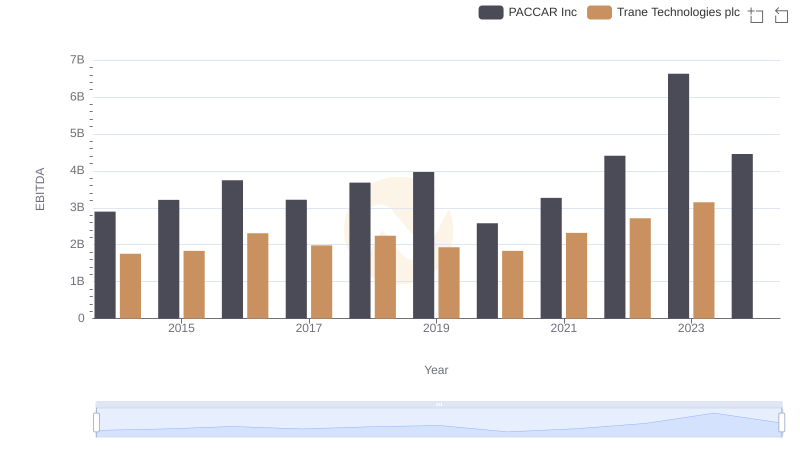
Trane Technologies plc vs PACCAR Inc: In-Depth EBITDA Performance Comparison
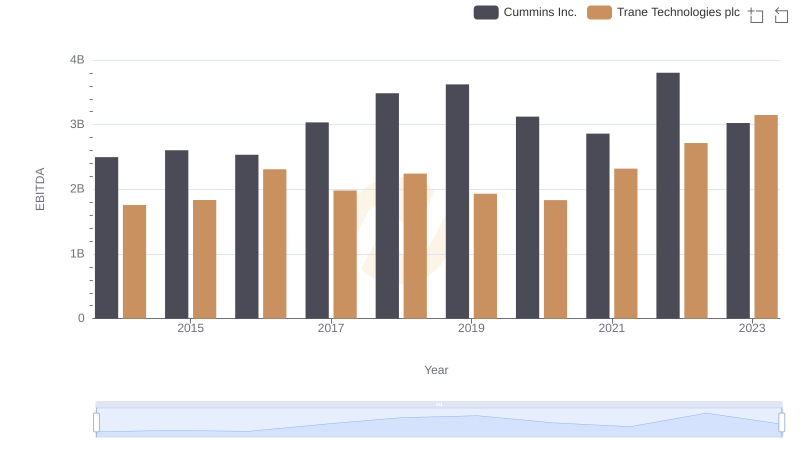
A Side-by-Side Analysis of EBITDA: Trane Technologies plc and Cummins Inc.