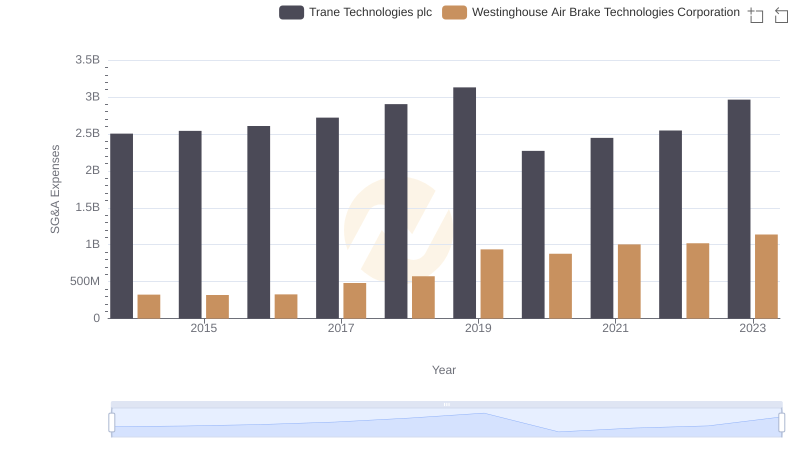
| __timestamp | Ingersoll Rand Inc. | Trane Technologies plc |
|---|---|---|
| Wednesday, January 1, 2014 | 476000000 | 2503900000 |
| Thursday, January 1, 2015 | 427000000 | 2541100000 |
| Friday, January 1, 2016 | 414339000 | 2606500000 |
| Sunday, January 1, 2017 | 446600000 | 2720700000 |
| Monday, January 1, 2018 | 434600000 | 2903200000 |
| Tuesday, January 1, 2019 | 436400000 | 3129800000 |
| Wednesday, January 1, 2020 | 894800000 | 2270600000 |
| Friday, January 1, 2021 | 1028000000 | 2446300000 |
| Saturday, January 1, 2022 | 1095800000 | 2545900000 |
| Sunday, January 1, 2023 | 1272700000 | 2963200000 |
| Monday, January 1, 2024 | 0 | 3580400000 |
Unveiling the hidden dimensions of data
In the competitive landscape of industrial manufacturing, Trane Technologies plc and Ingersoll Rand Inc. have long been titans. Over the past decade, their Selling, General, and Administrative (SG&A) expenses reveal intriguing trends. From 2014 to 2023, Trane Technologies consistently outpaced Ingersoll Rand, with expenses peaking at nearly 3 billion in 2019. In contrast, Ingersoll Rand's expenses showed a steady climb, reaching approximately 1.3 billion by 2023, marking a 167% increase from 2014.
This divergence highlights strategic differences. Trane's higher SG&A expenses suggest a robust investment in marketing and administration, potentially driving its market leadership. Meanwhile, Ingersoll Rand's gradual increase may reflect a more conservative approach, focusing on efficiency and cost management. As these companies continue to evolve, their SG&A trends offer valuable insights into their operational strategies and market positioning.
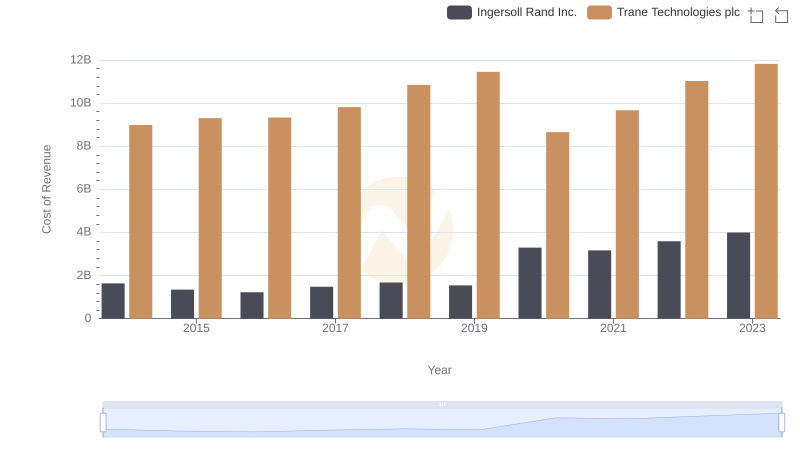
Cost of Revenue Comparison: Trane Technologies plc vs Ingersoll Rand Inc.
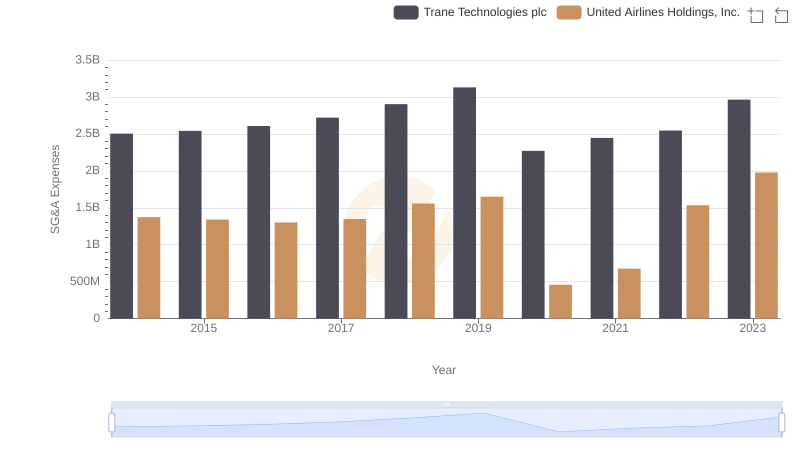
Trane Technologies plc vs United Airlines Holdings, Inc.: SG&A Expense Trends
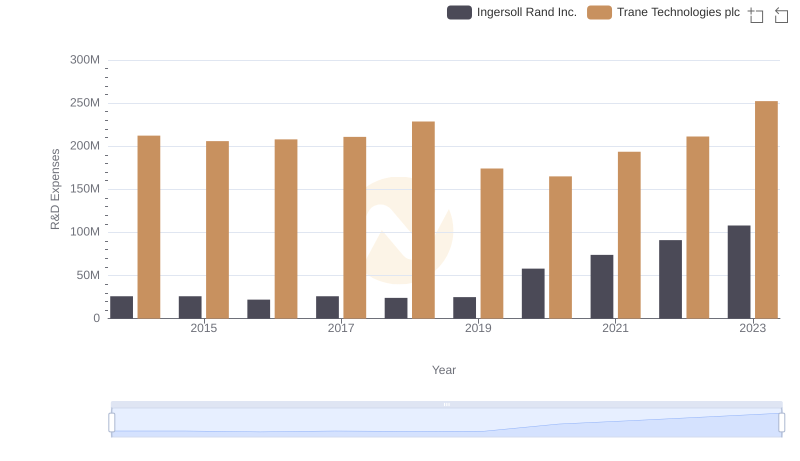
Analyzing R&D Budgets: Trane Technologies plc vs Ingersoll Rand Inc.
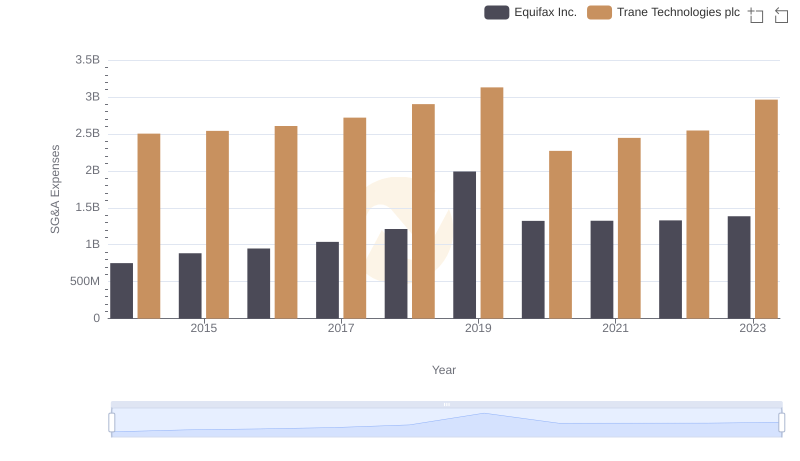
Breaking Down SG&A Expenses: Trane Technologies plc vs Equifax Inc.
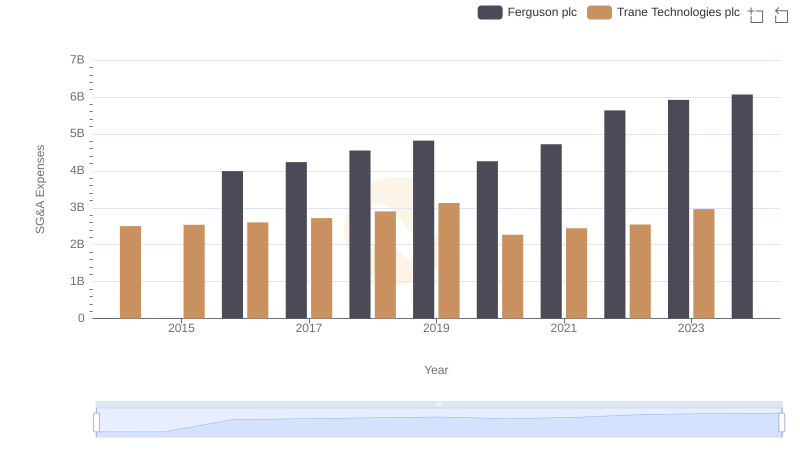
Trane Technologies plc vs Ferguson plc: SG&A Expense Trends
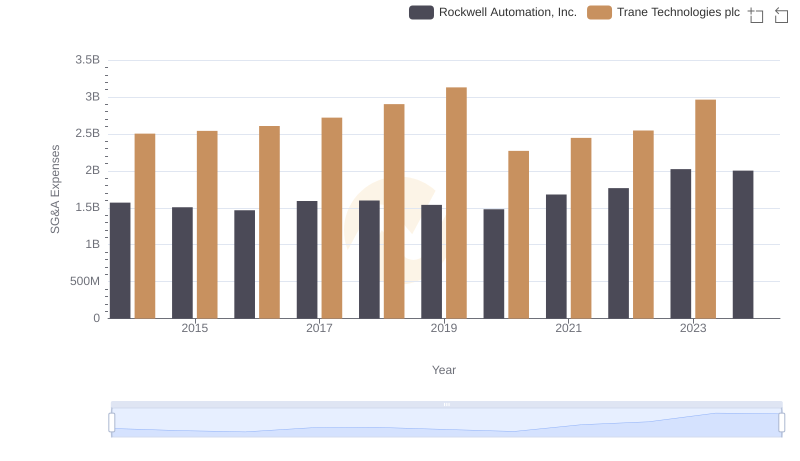
SG&A Efficiency Analysis: Comparing Trane Technologies plc and Rockwell Automation, Inc.
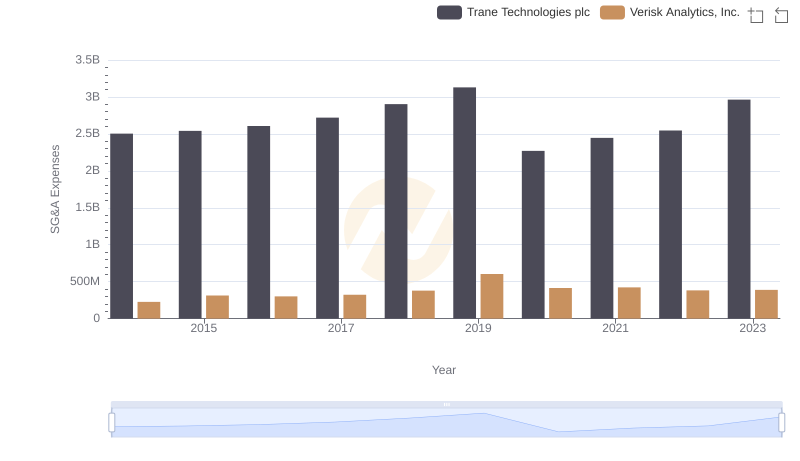
Cost Management Insights: SG&A Expenses for Trane Technologies plc and Verisk Analytics, Inc.
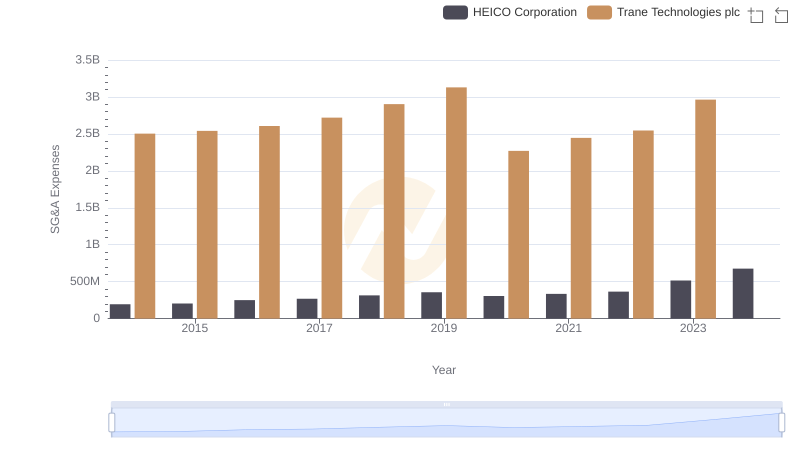
Trane Technologies plc or HEICO Corporation: Who Manages SG&A Costs Better?
Trane Technologies plc and Westinghouse Air Brake Technologies Corporation: SG&A Spending Patterns Compared