| __timestamp | Allegion plc | Rockwell Automation, Inc. |
|---|---|---|
| Wednesday, January 1, 2014 | 527400000 | 1570100000 |
| Thursday, January 1, 2015 | 510500000 | 1506400000 |
| Friday, January 1, 2016 | 559800000 | 1467400000 |
| Sunday, January 1, 2017 | 582500000 | 1591500000 |
| Monday, January 1, 2018 | 647500000 | 1599000000 |
| Tuesday, January 1, 2019 | 687200000 | 1538500000 |
| Wednesday, January 1, 2020 | 635700000 | 1479800000 |
| Friday, January 1, 2021 | 674700000 | 1680000000 |
| Saturday, January 1, 2022 | 736000000 | 1766700000 |
| Sunday, January 1, 2023 | 865600000 | 2023700000 |
| Monday, January 1, 2024 | 887800000 | 2002600000 |
Unlocking the unknown
In the ever-evolving landscape of industrial automation and security solutions, understanding the financial health of key players is crucial. Rockwell Automation, Inc. and Allegion plc, two giants in their respective fields, have shown distinct trends in their Selling, General, and Administrative (SG&A) expenses over the past decade. From 2014 to 2023, Rockwell Automation's SG&A expenses have consistently been higher, peaking at approximately $2 billion in 2023, marking a 29% increase from 2014. In contrast, Allegion plc's expenses have grown by 64% over the same period, reaching around $866 million in 2023. This divergence highlights Rockwell's expansive operational scale compared to Allegion's more focused growth strategy. Notably, the data for 2024 is incomplete, suggesting a need for cautious interpretation of future trends. These insights provide a window into the strategic priorities and operational efficiencies of these industry leaders.
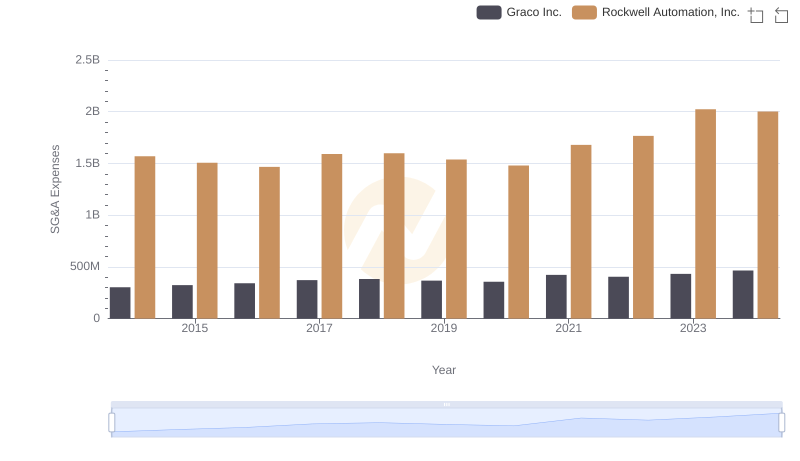
Rockwell Automation, Inc. and Graco Inc.: SG&A Spending Patterns Compared
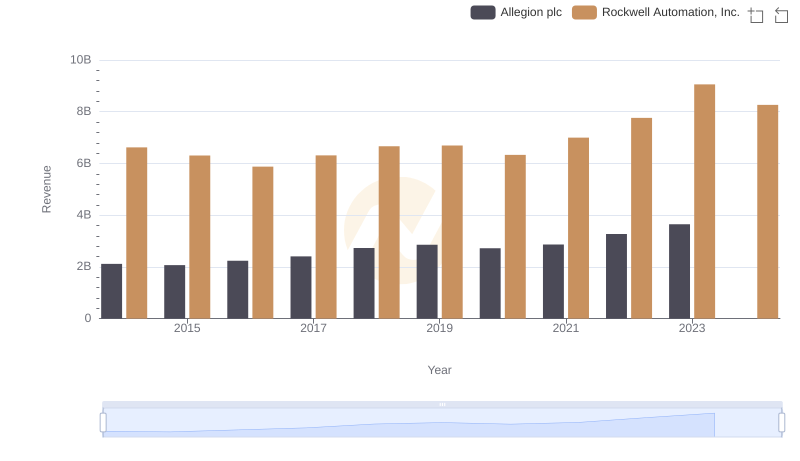
Comparing Revenue Performance: Rockwell Automation, Inc. or Allegion plc?
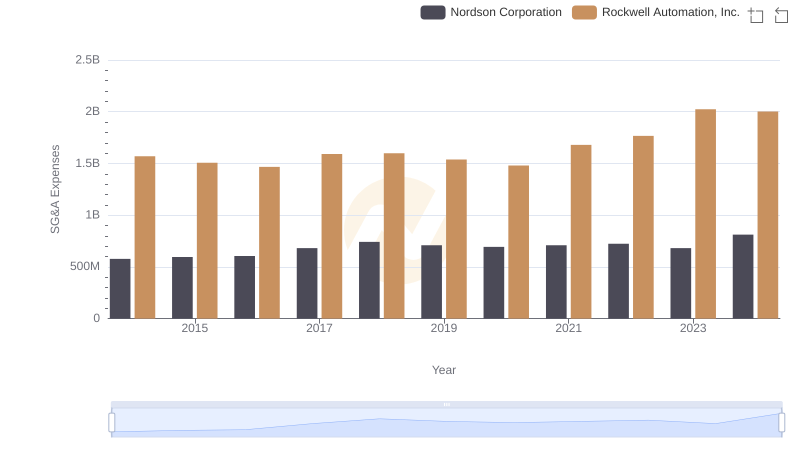
Selling, General, and Administrative Costs: Rockwell Automation, Inc. vs Nordson Corporation
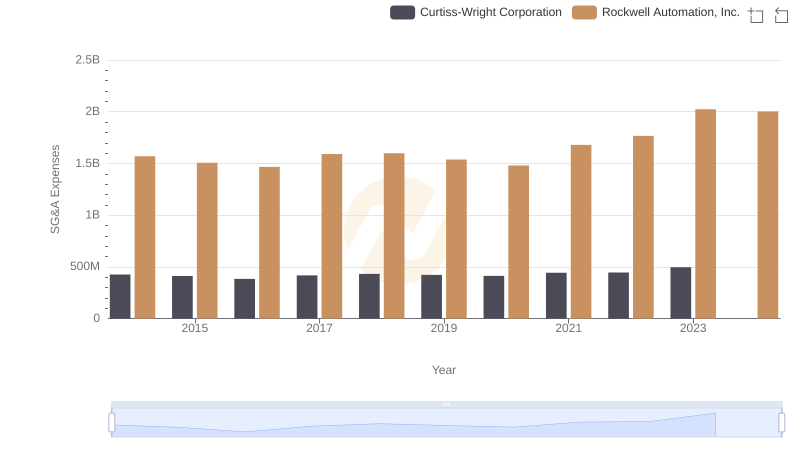
Comparing SG&A Expenses: Rockwell Automation, Inc. vs Curtiss-Wright Corporation Trends and Insights
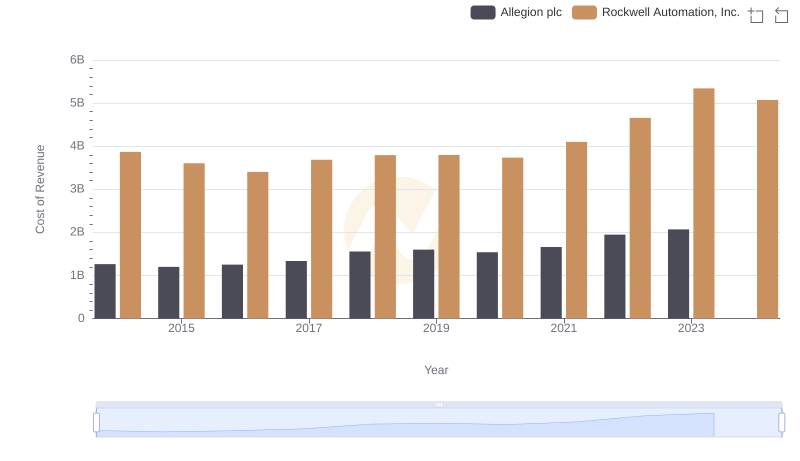
Cost of Revenue Comparison: Rockwell Automation, Inc. vs Allegion plc
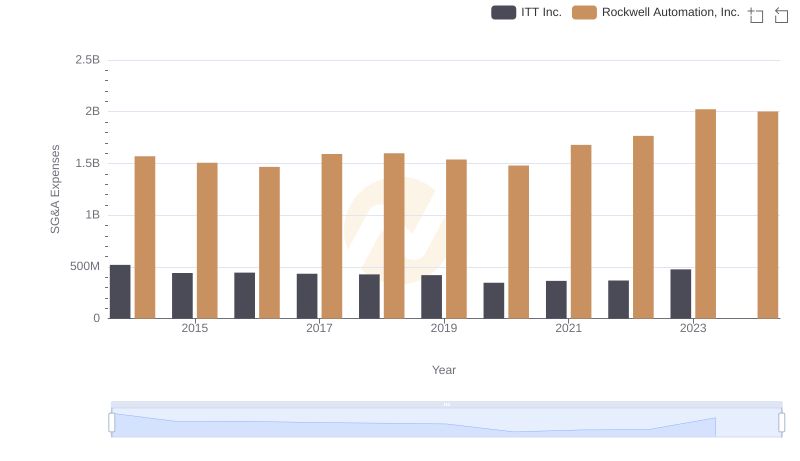
Rockwell Automation, Inc. and ITT Inc.: SG&A Spending Patterns Compared
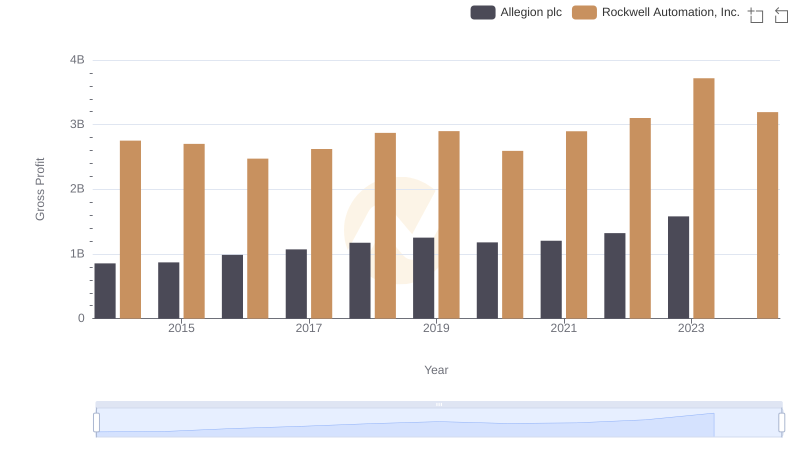
Rockwell Automation, Inc. and Allegion plc: A Detailed Gross Profit Analysis
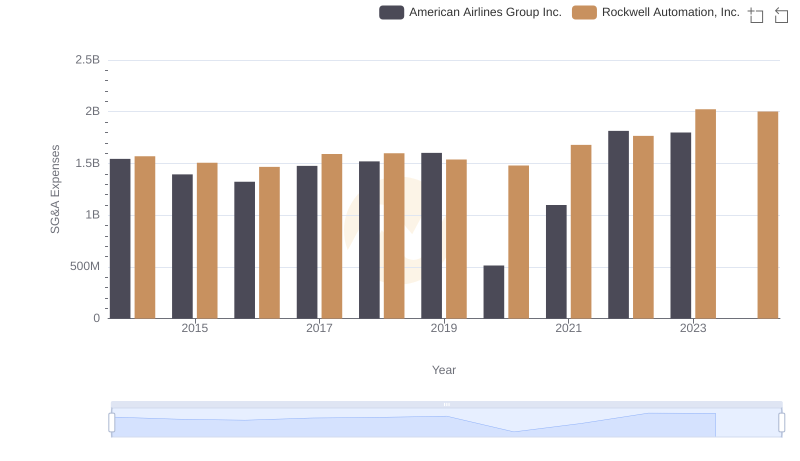
Rockwell Automation, Inc. vs American Airlines Group Inc.: SG&A Expense Trends
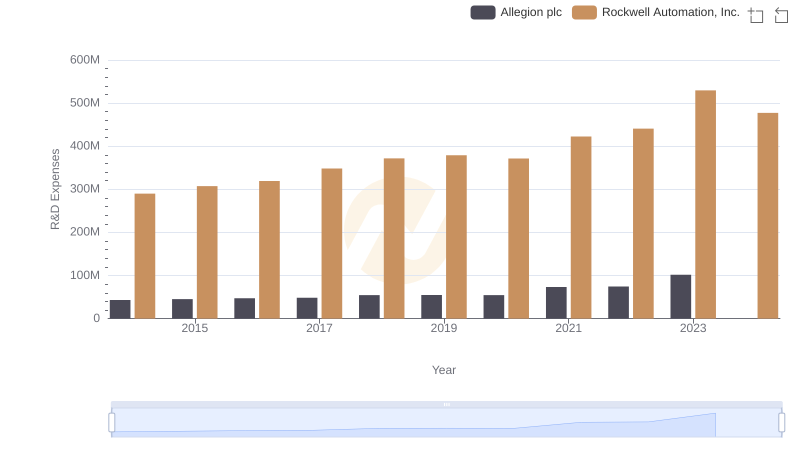
R&D Spending Showdown: Rockwell Automation, Inc. vs Allegion plc

Rockwell Automation, Inc. vs Allegion plc: In-Depth EBITDA Performance Comparison