| __timestamp | Parker-Hannifin Corporation | TransUnion |
|---|---|---|
| Wednesday, January 1, 2014 | 1633992000 | 436000000 |
| Thursday, January 1, 2015 | 1544746000 | 499700000 |
| Friday, January 1, 2016 | 1359360000 | 560100000 |
| Sunday, January 1, 2017 | 1453935000 | 585400000 |
| Monday, January 1, 2018 | 1657152000 | 707700000 |
| Tuesday, January 1, 2019 | 1543939000 | 812100000 |
| Wednesday, January 1, 2020 | 1656553000 | 860300000 |
| Friday, January 1, 2021 | 1527302000 | 943900000 |
| Saturday, January 1, 2022 | 1627116000 | 1337400000 |
| Sunday, January 1, 2023 | 3354103000 | 1171600000 |
| Monday, January 1, 2024 | 3315177000 | 1239300000 |
Igniting the spark of knowledge
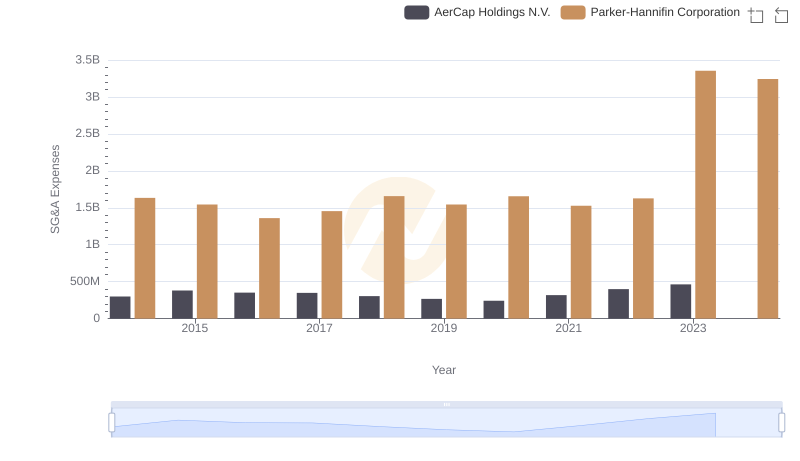
In the world of corporate finance, Selling, General, and Administrative (SG&A) expenses are a critical measure of a company's operational efficiency. Over the past decade, Parker-Hannifin Corporation and TransUnion have showcased contrasting trends in their SG&A expenses. From 2014 to 2023, Parker-Hannifin's SG&A costs have surged by over 100%, peaking in 2023. This dramatic increase highlights the company's aggressive expansion and investment strategies. In contrast, TransUnion's expenses have grown more modestly, with a notable 54% rise from 2014 to 2022, reflecting a more conservative approach. Interestingly, data for 2024 is missing for TransUnion, leaving room for speculation on future trends. This comparison not only underscores the strategic differences between these two industry leaders but also offers insights into their financial health and market positioning. As businesses navigate the complexities of the modern economy, understanding these dynamics becomes crucial for investors and analysts alike.
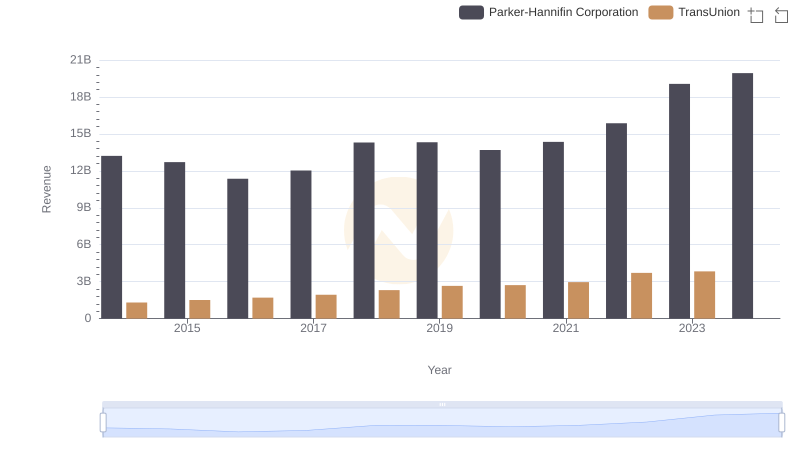
Parker-Hannifin Corporation or TransUnion: Who Leads in Yearly Revenue?

Cost of Revenue Comparison: Parker-Hannifin Corporation vs TransUnion
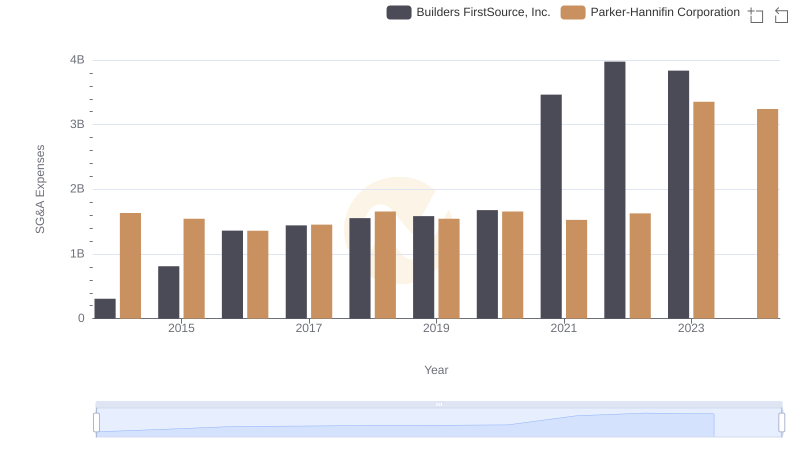
Comparing SG&A Expenses: Parker-Hannifin Corporation vs Builders FirstSource, Inc. Trends and Insights
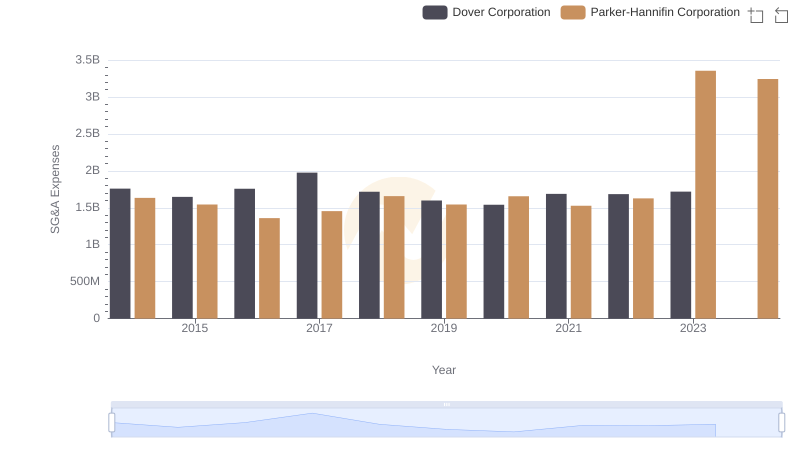
Parker-Hannifin Corporation and Dover Corporation: SG&A Spending Patterns Compared
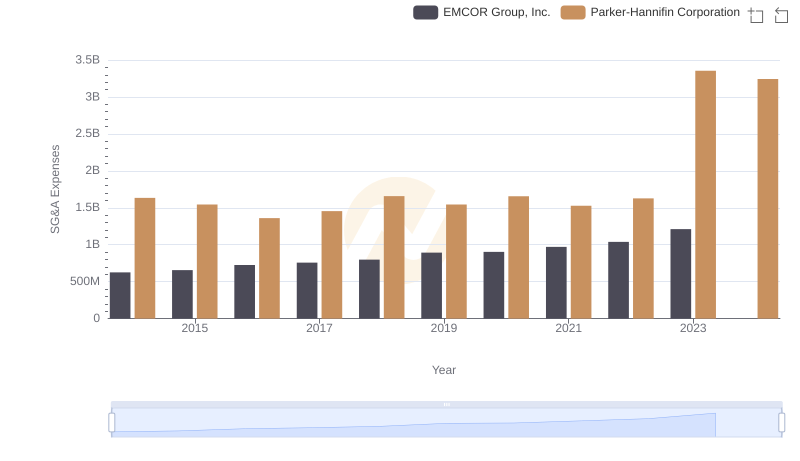
Who Optimizes SG&A Costs Better? Parker-Hannifin Corporation or EMCOR Group, Inc.
Who Optimizes SG&A Costs Better? Parker-Hannifin Corporation or AerCap Holdings N.V.