| __timestamp | Norfolk Southern Corporation | Parker-Hannifin Corporation |
|---|---|---|
| Wednesday, January 1, 2014 | 7109000000 | 10188227000 |
| Thursday, January 1, 2015 | 6651000000 | 9655245000 |
| Friday, January 1, 2016 | 6015000000 | 8823384000 |
| Sunday, January 1, 2017 | 6224000000 | 9188962000 |
| Monday, January 1, 2018 | 6844000000 | 10762841000 |
| Tuesday, January 1, 2019 | 6567000000 | 10703484000 |
| Wednesday, January 1, 2020 | 5749000000 | 10286518000 |
| Friday, January 1, 2021 | 6148000000 | 10449680000 |
| Saturday, January 1, 2022 | 7223000000 | 11387267000 |
| Sunday, January 1, 2023 | 6774000000 | 12635892000 |
| Monday, January 1, 2024 | 7580000000 | 12801816000 |
Cracking the code
In the ever-evolving landscape of American industry, Parker-Hannifin Corporation and Norfolk Southern Corporation stand as titans in their respective fields. From 2014 to 2023, Parker-Hannifin consistently outpaced Norfolk Southern in terms of cost of revenue, with a notable 20% higher average. This trend underscores Parker-Hannifin's expansive operations in motion and control technologies. Norfolk Southern, a leader in rail transportation, saw fluctuations, peaking in 2014 and 2022, reflecting the dynamic nature of the logistics sector. Interestingly, Parker-Hannifin's cost of revenue surged by approximately 24% from 2016 to 2023, highlighting its aggressive growth strategy. Meanwhile, Norfolk Southern's cost of revenue remained relatively stable, with a slight dip in 2020, likely due to pandemic-related disruptions. As we look to 2024, Parker-Hannifin's data continues, while Norfolk Southern's remains elusive, leaving room for speculation on future trends.
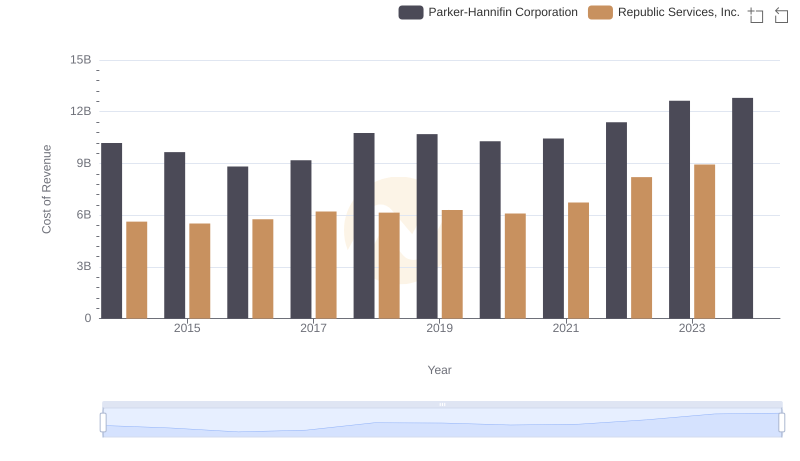
Cost of Revenue Comparison: Parker-Hannifin Corporation vs Republic Services, Inc.
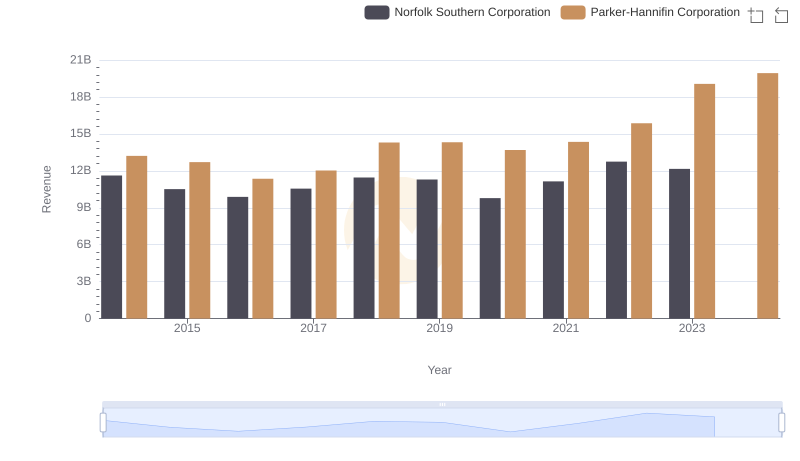
Revenue Insights: Parker-Hannifin Corporation and Norfolk Southern Corporation Performance Compared
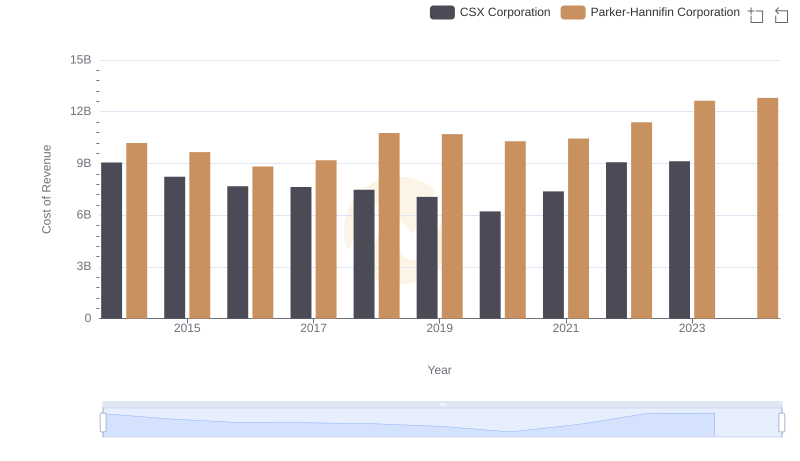
Cost of Revenue Trends: Parker-Hannifin Corporation vs CSX Corporation
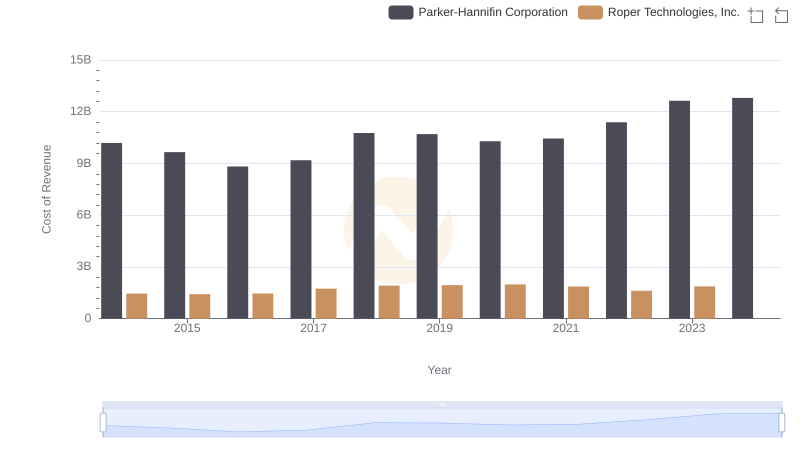
Cost Insights: Breaking Down Parker-Hannifin Corporation and Roper Technologies, Inc.'s Expenses
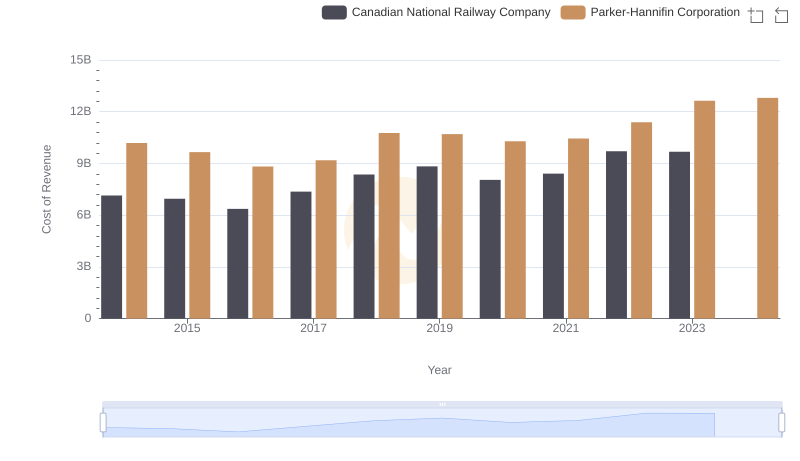
Cost of Revenue Trends: Parker-Hannifin Corporation vs Canadian National Railway Company
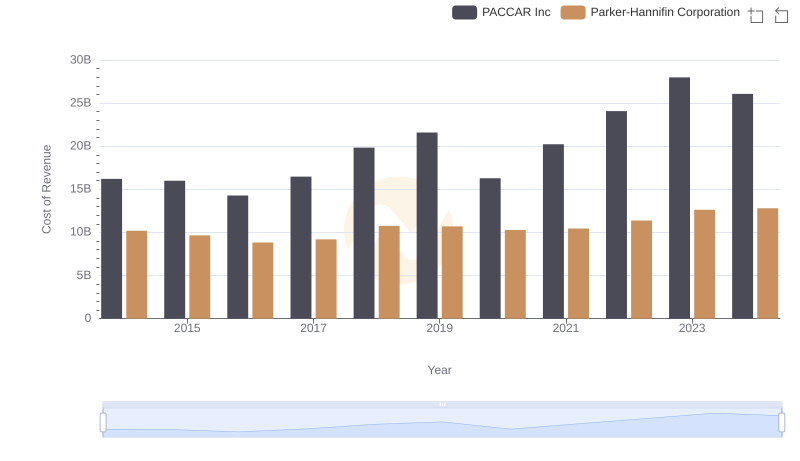
Comparing Cost of Revenue Efficiency: Parker-Hannifin Corporation vs PACCAR Inc
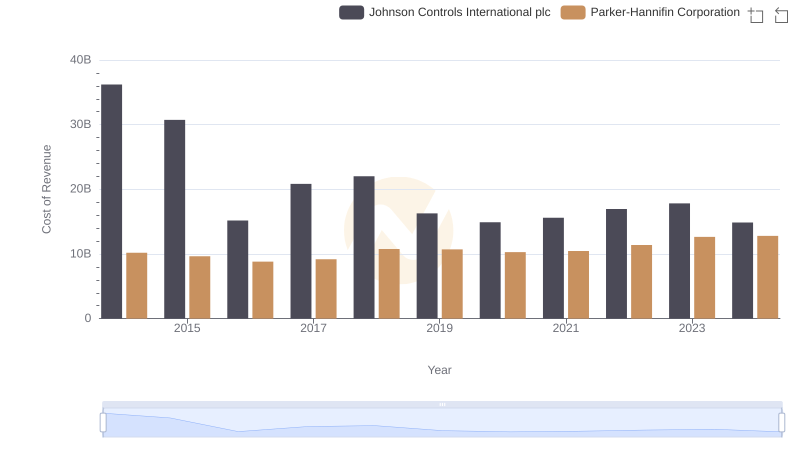
Cost of Revenue Comparison: Parker-Hannifin Corporation vs Johnson Controls International plc
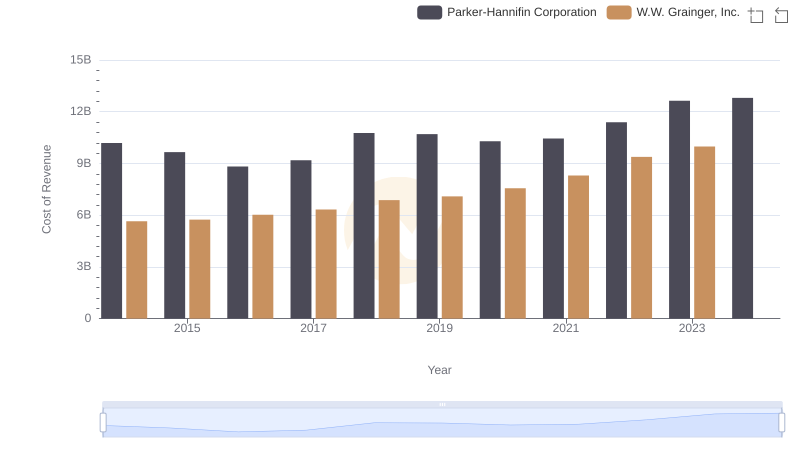
Comparing Cost of Revenue Efficiency: Parker-Hannifin Corporation vs W.W. Grainger, Inc.
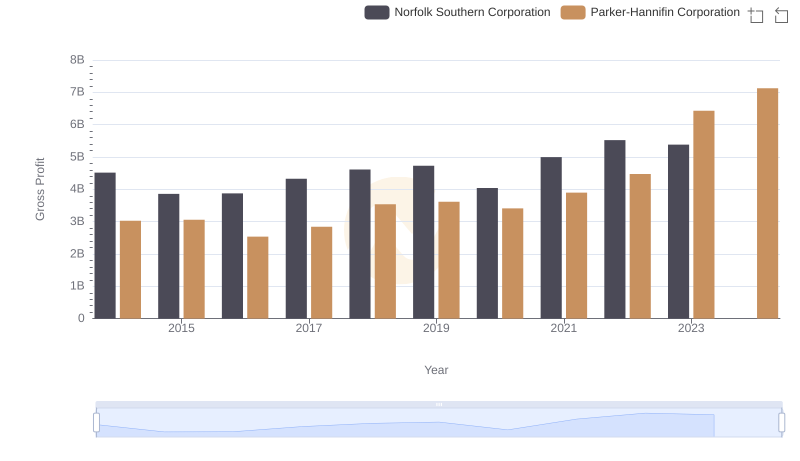
Who Generates Higher Gross Profit? Parker-Hannifin Corporation or Norfolk Southern Corporation
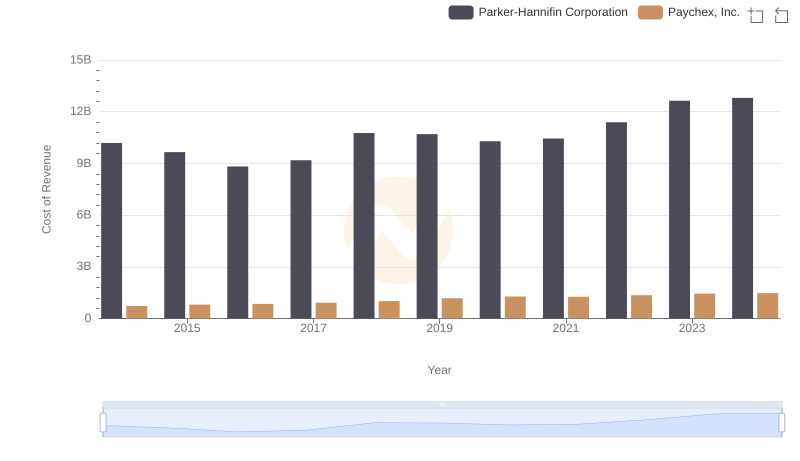
Comparing Cost of Revenue Efficiency: Parker-Hannifin Corporation vs Paychex, Inc.
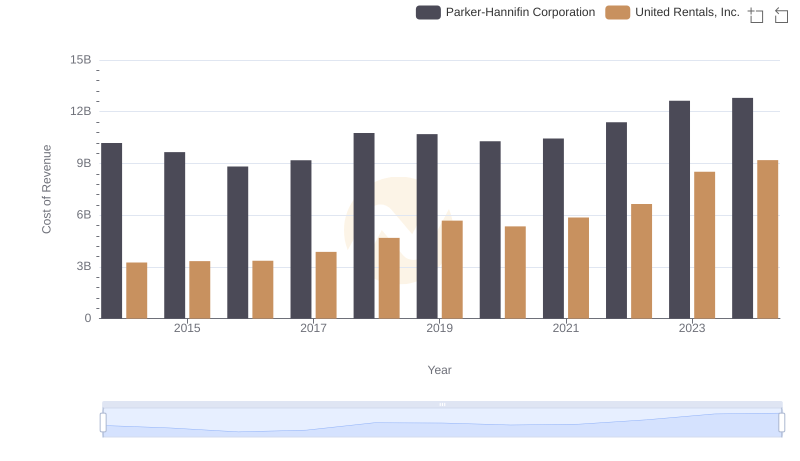
Analyzing Cost of Revenue: Parker-Hannifin Corporation and United Rentals, Inc.

A Professional Review of EBITDA: Parker-Hannifin Corporation Compared to Norfolk Southern Corporation