| __timestamp | Dover Corporation | Parker-Hannifin Corporation |
|---|---|---|
| Wednesday, January 1, 2014 | 4778479000 | 10188227000 |
| Thursday, January 1, 2015 | 4388167000 | 9655245000 |
| Friday, January 1, 2016 | 4322373000 | 8823384000 |
| Sunday, January 1, 2017 | 4940059000 | 9188962000 |
| Monday, January 1, 2018 | 4432562000 | 10762841000 |
| Tuesday, January 1, 2019 | 4515459000 | 10703484000 |
| Wednesday, January 1, 2020 | 4209741000 | 10286518000 |
| Friday, January 1, 2021 | 4937295000 | 10449680000 |
| Saturday, January 1, 2022 | 5444532000 | 11387267000 |
| Sunday, January 1, 2023 | 5353501000 | 12635892000 |
| Monday, January 1, 2024 | 4787288000 | 12801816000 |
In pursuit of knowledge
In the ever-evolving landscape of industrial manufacturing, understanding cost structures is pivotal. Parker-Hannifin Corporation and Dover Corporation, two giants in the sector, have shown distinct trends in their cost of revenue over the past decade. From 2014 to 2023, Parker-Hannifin's expenses have surged by approximately 24%, peaking in 2023 with a cost of revenue of $12.6 billion. In contrast, Dover Corporation's costs have seen a more modest increase of around 12%, reaching $5.4 billion in 2022. Notably, Parker-Hannifin consistently outpaces Dover, with costs nearly double those of its counterpart. This disparity highlights Parker-Hannifin's expansive operations and possibly higher input costs. However, the absence of data for Dover in 2024 leaves room for speculation on future trends. As these companies navigate economic shifts, their cost strategies will be crucial in maintaining competitive edges.
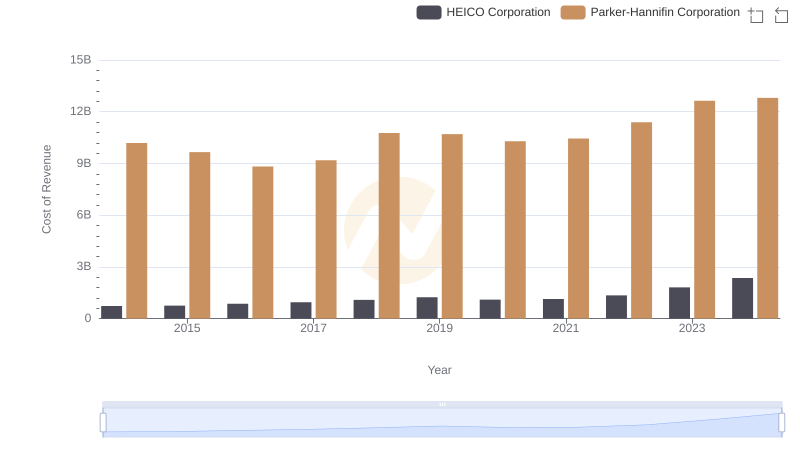
Cost of Revenue Comparison: Parker-Hannifin Corporation vs HEICO Corporation

Who Generates More Revenue? Parker-Hannifin Corporation or Dover Corporation
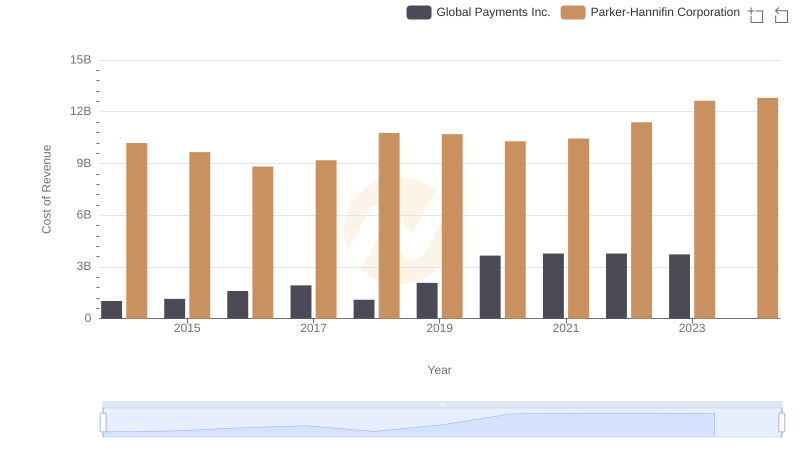
Cost Insights: Breaking Down Parker-Hannifin Corporation and Global Payments Inc.'s Expenses
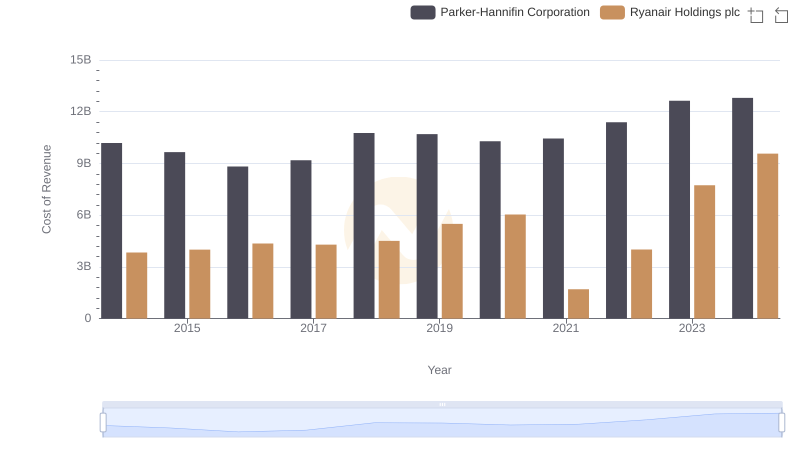
Cost Insights: Breaking Down Parker-Hannifin Corporation and Ryanair Holdings plc's Expenses
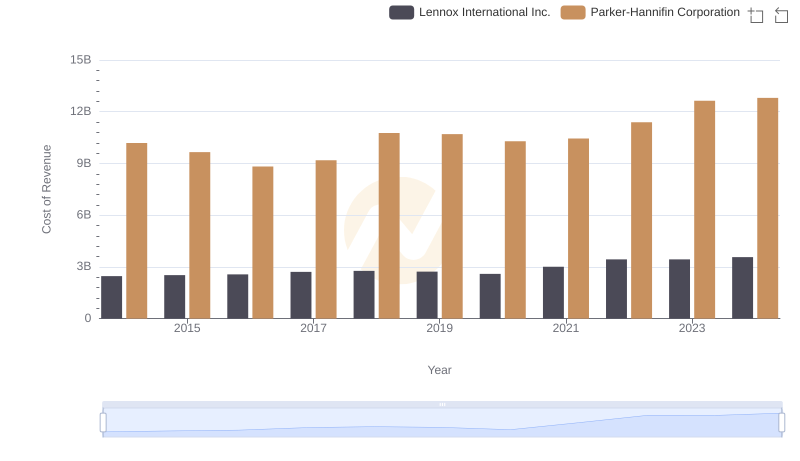
Analyzing Cost of Revenue: Parker-Hannifin Corporation and Lennox International Inc.

Analyzing Cost of Revenue: Parker-Hannifin Corporation and Builders FirstSource, Inc.
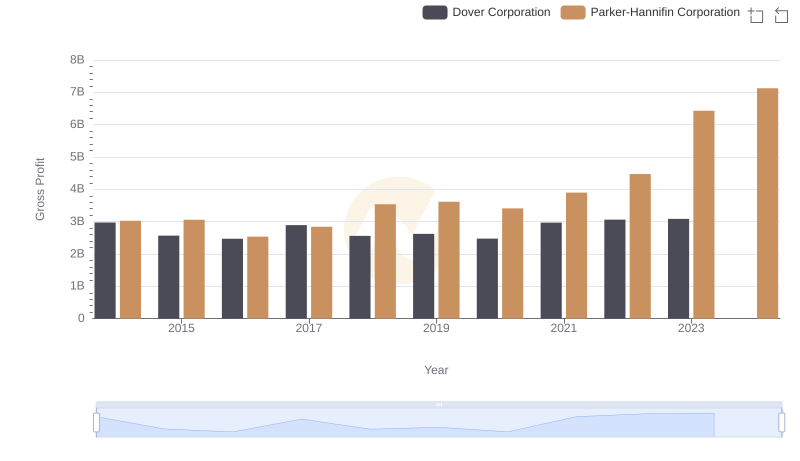
Gross Profit Comparison: Parker-Hannifin Corporation and Dover Corporation Trends
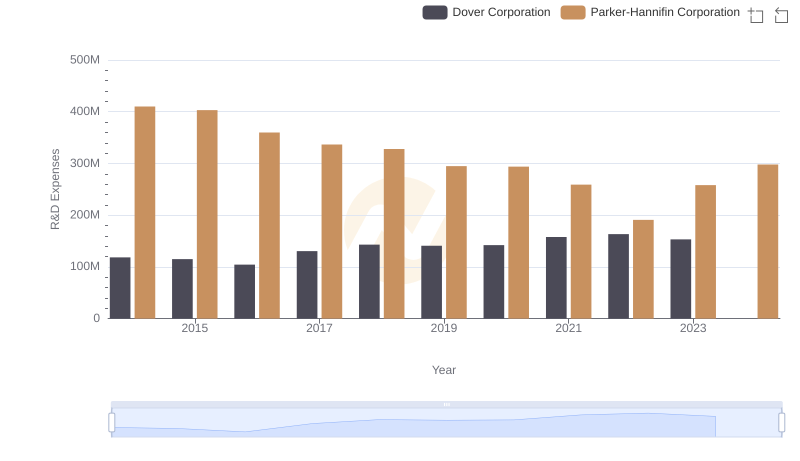
Research and Development: Comparing Key Metrics for Parker-Hannifin Corporation and Dover Corporation
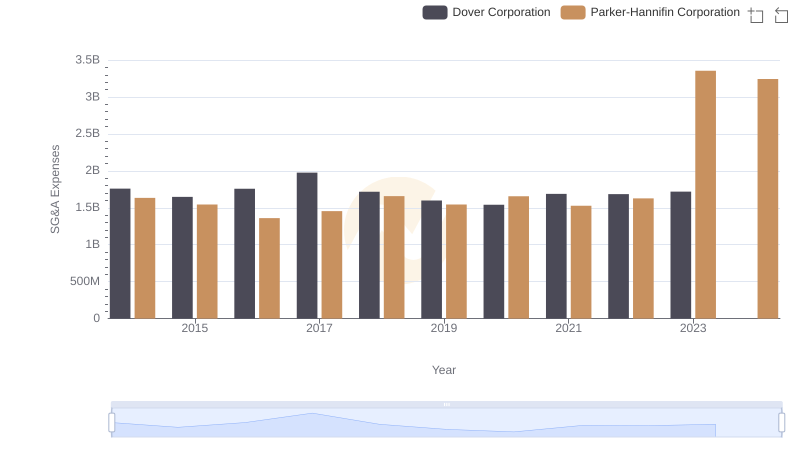
Parker-Hannifin Corporation and Dover Corporation: SG&A Spending Patterns Compared