| __timestamp | Eaton Corporation plc | Watsco, Inc. |
|---|---|---|
| Wednesday, January 1, 2014 | 3586000000 | 323674000 |
| Thursday, January 1, 2015 | 3302000000 | 355865000 |
| Friday, January 1, 2016 | 3176000000 | 365698000 |
| Sunday, January 1, 2017 | 3418000000 | 375907000 |
| Monday, January 1, 2018 | 3875000000 | 394177000 |
| Tuesday, January 1, 2019 | 2827000000 | 391396000 |
| Wednesday, January 1, 2020 | 1674000000 | 426942000 |
| Friday, January 1, 2021 | 2423000000 | 656655000 |
| Saturday, January 1, 2022 | 3031000000 | 863261000 |
| Sunday, January 1, 2023 | 4904000000 | 829900000 |
| Monday, January 1, 2024 | 5547999771 | 781775000 |
In pursuit of knowledge
In the competitive landscape of industrial and HVAC sectors, Eaton Corporation plc and Watsco, Inc. have showcased distinct EBITDA trajectories over the past decade. From 2014 to 2023, Eaton's EBITDA has seen a robust growth of approximately 37%, peaking in 2023 with a remarkable 4.9 billion. In contrast, Watsco's EBITDA, while smaller in scale, has demonstrated a steady upward trend, culminating in an impressive 166% increase over the same period, reaching 863 million in 2022.
Eaton's performance highlights its resilience and strategic prowess, particularly in 2023, where it achieved its highest EBITDA. Meanwhile, Watsco's consistent growth underscores its effective market strategies and adaptability. This comparative analysis not only reflects the financial health of these industry giants but also offers valuable insights into their strategic directions and market positioning.
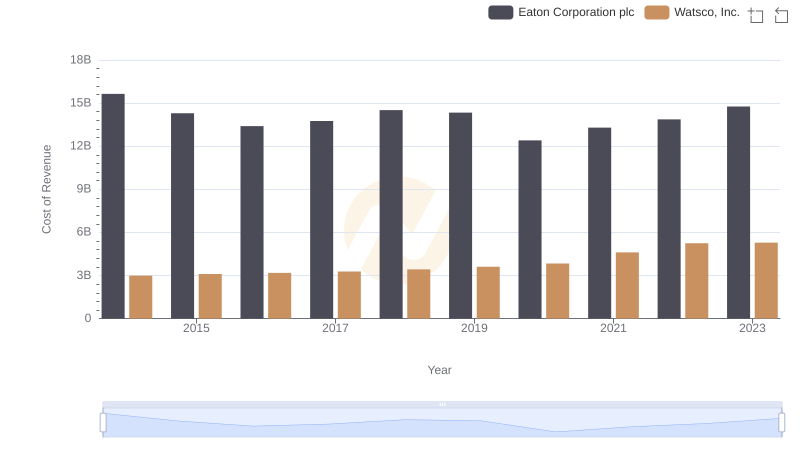
Cost of Revenue Comparison: Eaton Corporation plc vs Watsco, Inc.
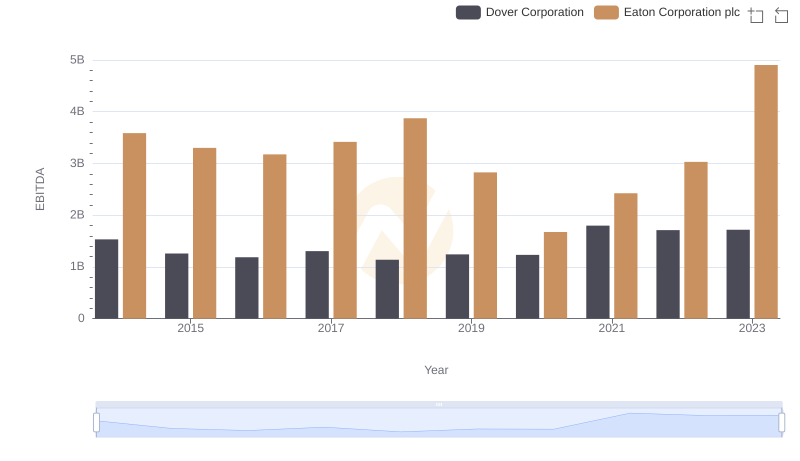
Comparative EBITDA Analysis: Eaton Corporation plc vs Dover Corporation
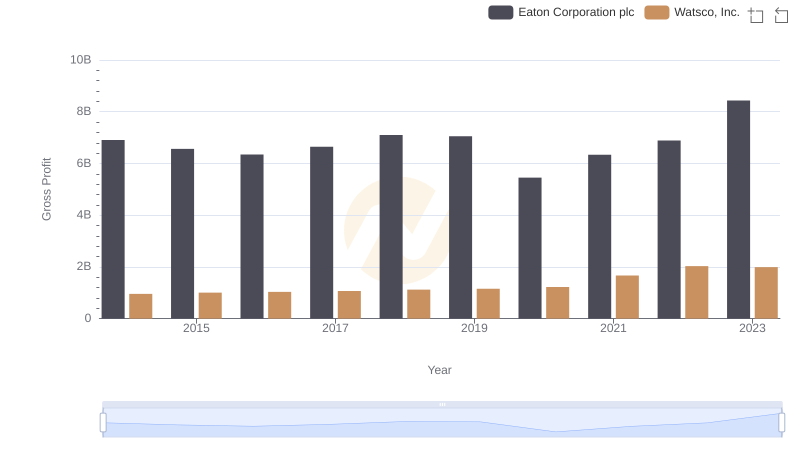
Eaton Corporation plc and Watsco, Inc.: A Detailed Gross Profit Analysis
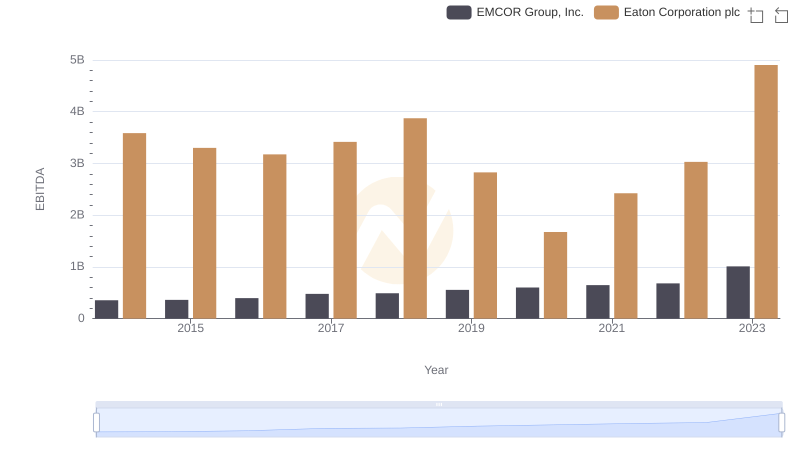
Eaton Corporation plc and EMCOR Group, Inc.: A Detailed Examination of EBITDA Performance
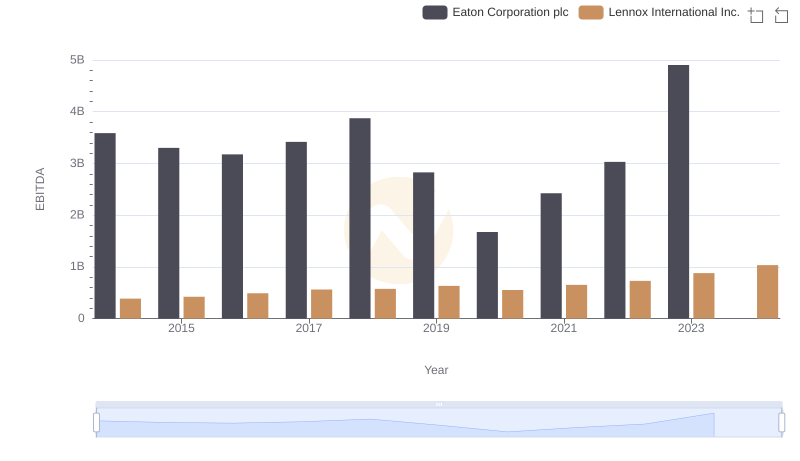
Eaton Corporation plc vs Lennox International Inc.: In-Depth EBITDA Performance Comparison
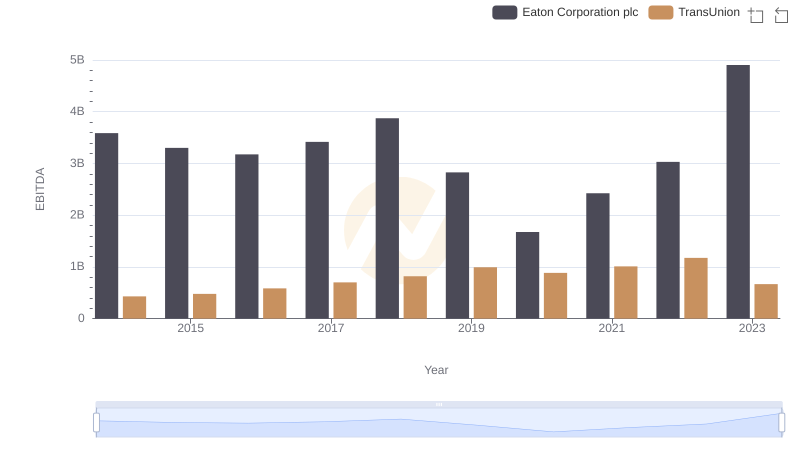
Eaton Corporation plc vs TransUnion: In-Depth EBITDA Performance Comparison