| __timestamp | Eaton Corporation plc | Watsco, Inc. |
|---|---|---|
| Wednesday, January 1, 2014 | 6906000000 | 956402000 |
| Thursday, January 1, 2015 | 6563000000 | 1007357000 |
| Friday, January 1, 2016 | 6347000000 | 1034584000 |
| Sunday, January 1, 2017 | 6648000000 | 1065659000 |
| Monday, January 1, 2018 | 7098000000 | 1120252000 |
| Tuesday, January 1, 2019 | 7052000000 | 1156956000 |
| Wednesday, January 1, 2020 | 5450000000 | 1222821000 |
| Friday, January 1, 2021 | 6335000000 | 1667545000 |
| Saturday, January 1, 2022 | 6887000000 | 2030289000 |
| Sunday, January 1, 2023 | 8433000000 | 1992140000 |
| Monday, January 1, 2024 | 9503000000 | 2044713000 |
Infusing magic into the data realm
In the ever-evolving landscape of industrial and HVAC sectors, Eaton Corporation plc and Watsco, Inc. have demonstrated remarkable resilience and growth over the past decade. From 2014 to 2023, Eaton's gross profit surged by approximately 22%, peaking in 2023 with a notable increase of 23% from the previous year. Meanwhile, Watsco, Inc. experienced a staggering 108% growth in gross profit, with a significant leap in 2022, marking a 22% rise from 2021.
This analysis highlights Eaton's steady recovery post-2020, a year marked by global economic challenges, while Watsco's consistent upward trajectory underscores its robust market position. As we delve into these financial narratives, it becomes evident that strategic innovation and market adaptability have been pivotal in driving these companies' financial success.
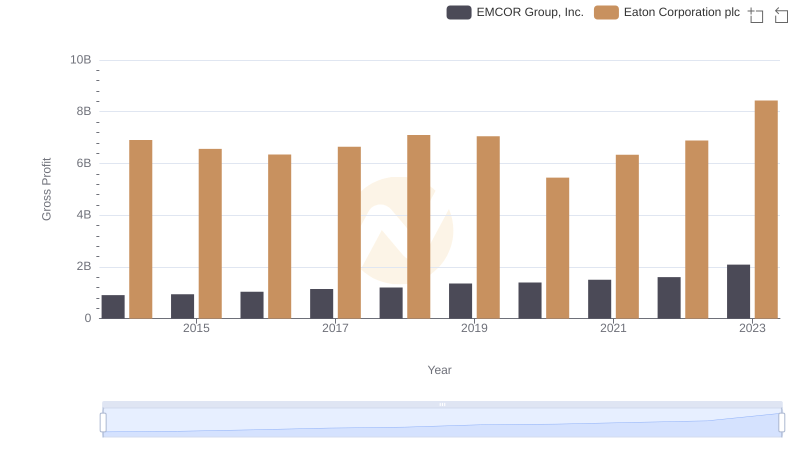
Eaton Corporation plc vs EMCOR Group, Inc.: A Gross Profit Performance Breakdown
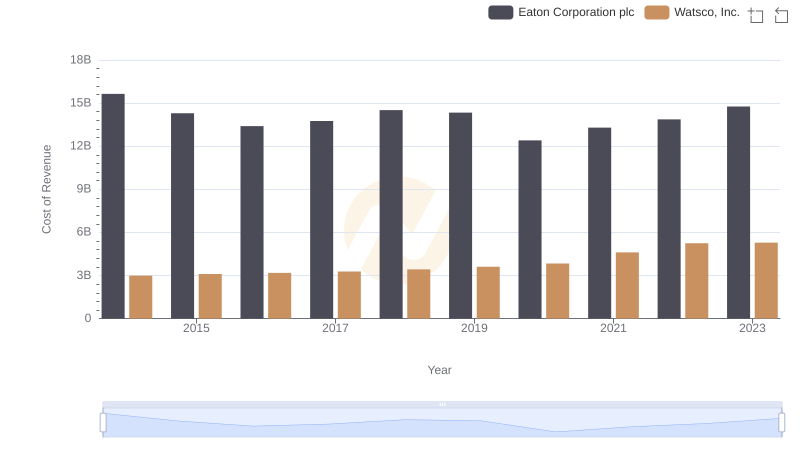
Cost of Revenue Comparison: Eaton Corporation plc vs Watsco, Inc.
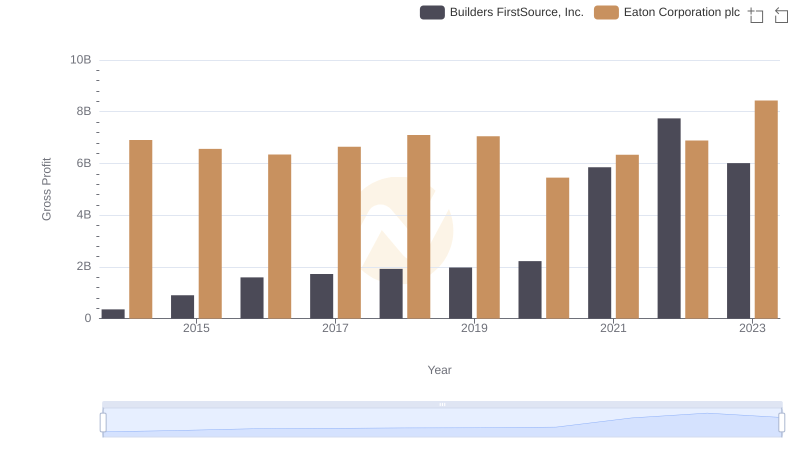
Eaton Corporation plc and Builders FirstSource, Inc.: A Detailed Gross Profit Analysis
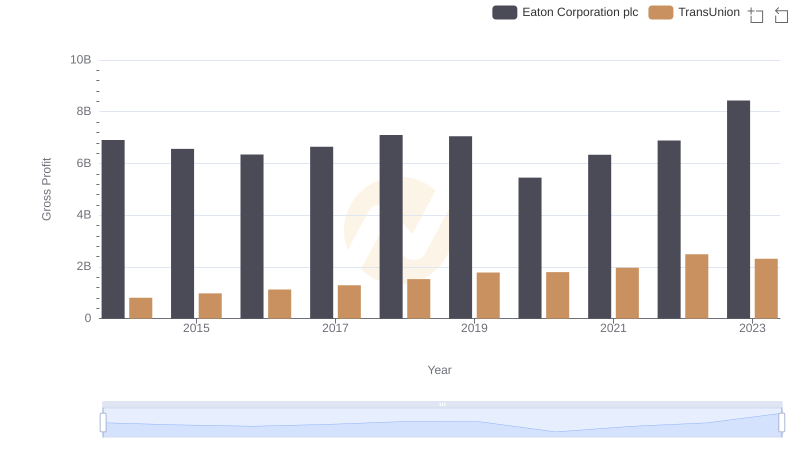
Gross Profit Trends Compared: Eaton Corporation plc vs TransUnion
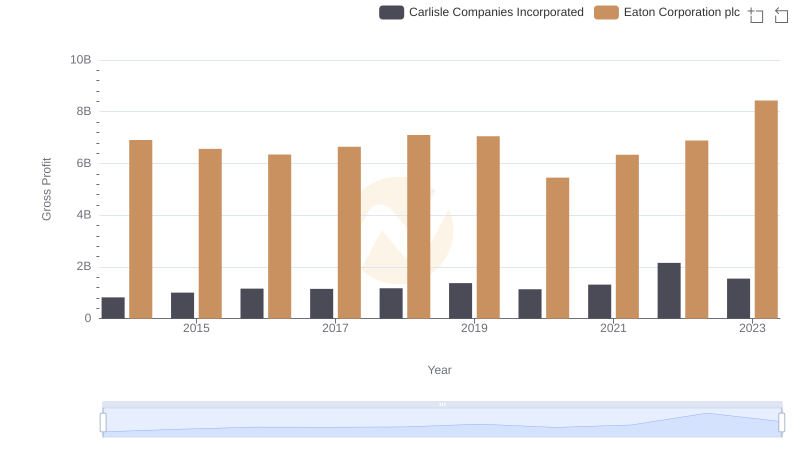
Gross Profit Comparison: Eaton Corporation plc and Carlisle Companies Incorporated Trends
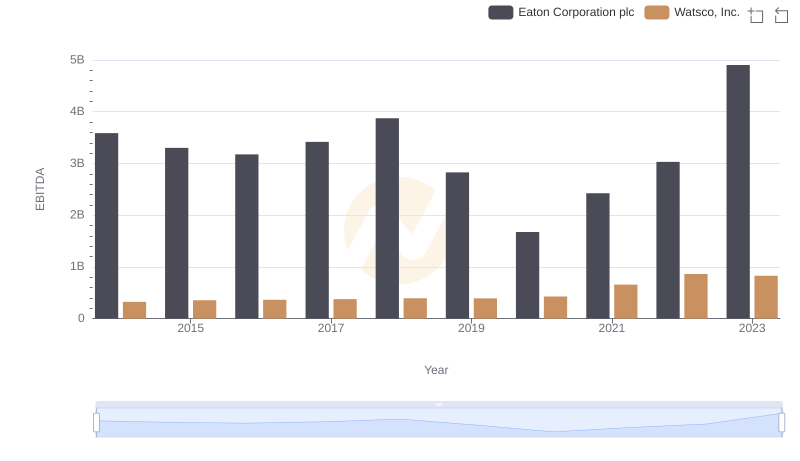
Professional EBITDA Benchmarking: Eaton Corporation plc vs Watsco, Inc.