| __timestamp | Cintas Corporation | Northrop Grumman Corporation |
|---|---|---|
| Wednesday, January 1, 2014 | 2637426000 | 18378000000 |
| Thursday, January 1, 2015 | 2555549000 | 17884000000 |
| Friday, January 1, 2016 | 2775588000 | 18731000000 |
| Sunday, January 1, 2017 | 2943086000 | 19849000000 |
| Monday, January 1, 2018 | 3568109000 | 23304000000 |
| Tuesday, January 1, 2019 | 3763715000 | 26582000000 |
| Wednesday, January 1, 2020 | 3851372000 | 29321000000 |
| Friday, January 1, 2021 | 3801689000 | 28399000000 |
| Saturday, January 1, 2022 | 4222213000 | 29128000000 |
| Sunday, January 1, 2023 | 4642401000 | 32739000000 |
| Monday, January 1, 2024 | 4910199000 | 32671000000 |
Unleashing the power of data
In the past decade, Cintas Corporation and Northrop Grumman Corporation have shown distinct trajectories in their cost of revenue. Cintas, a leader in corporate uniform supply, has seen a steady increase, with costs rising by approximately 86% from 2014 to 2023. This growth reflects their expanding market presence and operational scale. Meanwhile, Northrop Grumman, a giant in the aerospace and defense sector, experienced a 78% increase over the same period, peaking in 2023. This surge aligns with heightened defense spending and technological advancements. Notably, data for 2024 is incomplete, highlighting potential future uncertainties. These trends underscore the dynamic nature of operational costs in different industries, driven by market demands and strategic investments. As businesses navigate these financial landscapes, understanding such patterns is crucial for stakeholders aiming to optimize performance and forecast future challenges.
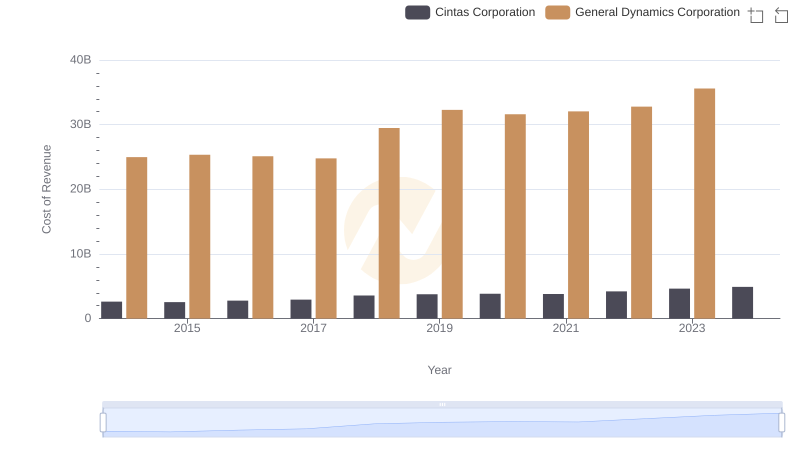
Cintas Corporation vs General Dynamics Corporation: Efficiency in Cost of Revenue Explored
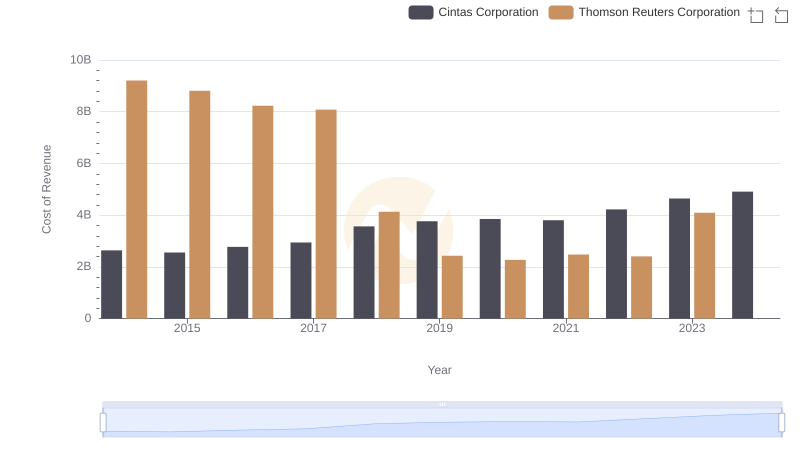
Cost Insights: Breaking Down Cintas Corporation and Thomson Reuters Corporation's Expenses
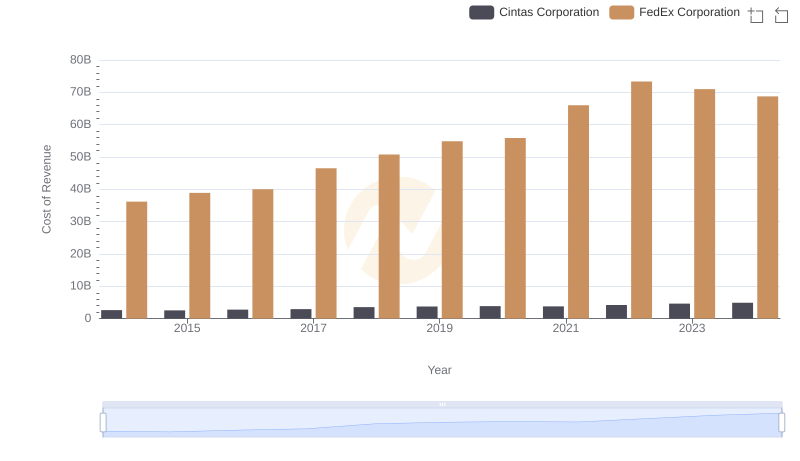
Cintas Corporation vs FedEx Corporation: Efficiency in Cost of Revenue Explored
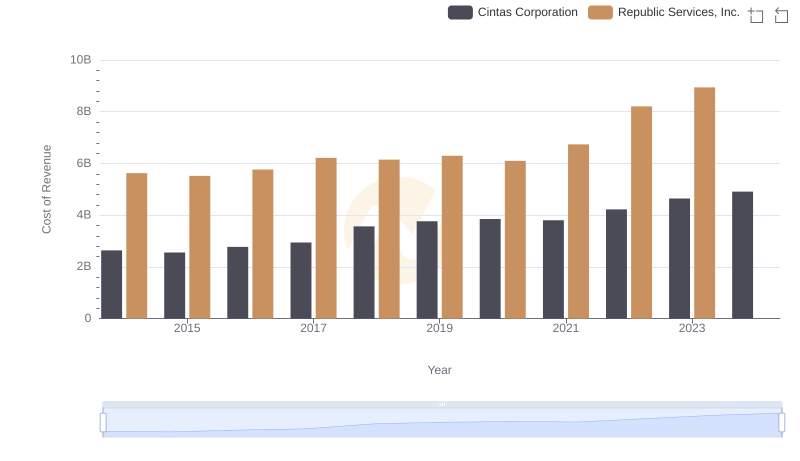
Cost Insights: Breaking Down Cintas Corporation and Republic Services, Inc.'s Expenses
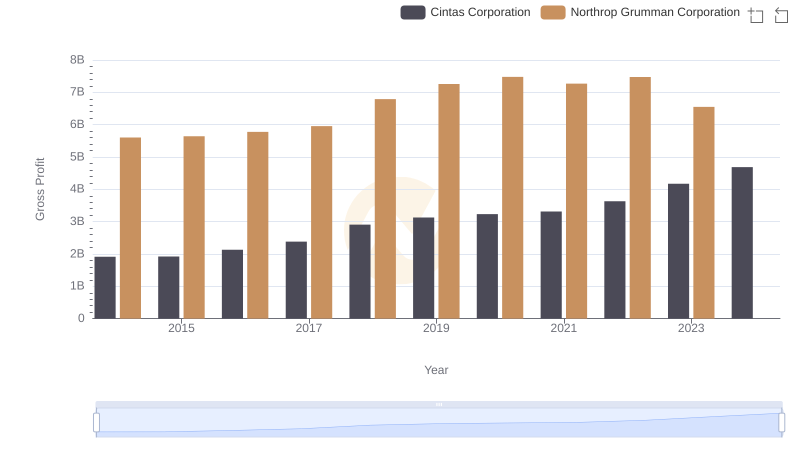
Cintas Corporation and Northrop Grumman Corporation: A Detailed Gross Profit Analysis
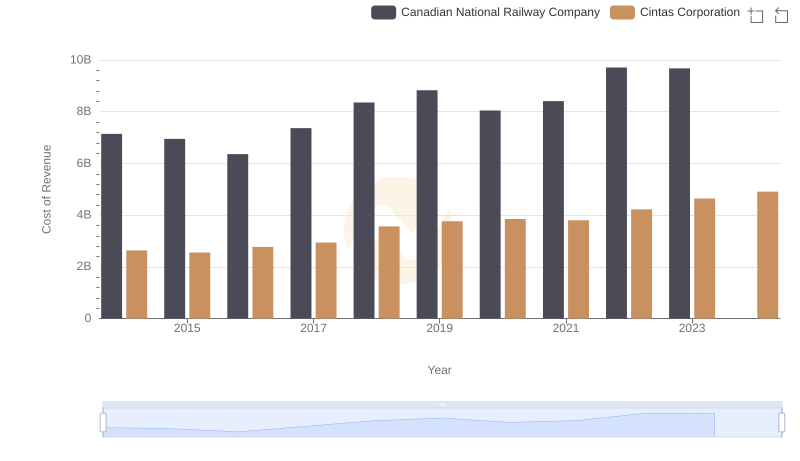
Cost Insights: Breaking Down Cintas Corporation and Canadian National Railway Company's Expenses
Cost of Revenue Comparison: Cintas Corporation vs Roper Technologies, Inc.
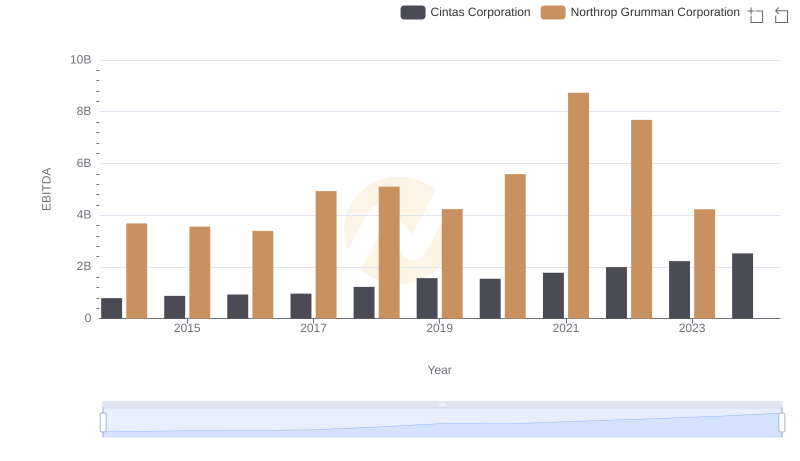
Comparative EBITDA Analysis: Cintas Corporation vs Northrop Grumman Corporation