| __timestamp | AMETEK, Inc. | Expeditors International of Washington, Inc. |
|---|---|---|
| Wednesday, January 1, 2014 | 462637000 | 38125000 |
| Thursday, January 1, 2015 | 448592000 | 41990000 |
| Friday, January 1, 2016 | 462970000 | 41763000 |
| Sunday, January 1, 2017 | 533645000 | 44290000 |
| Monday, January 1, 2018 | 584022000 | 45346000 |
| Tuesday, January 1, 2019 | 610280000 | 44002000 |
| Wednesday, January 1, 2020 | 515630000 | 18436000 |
| Friday, January 1, 2021 | 603944000 | 16026000 |
| Saturday, January 1, 2022 | 644577000 | 24293000 |
| Sunday, January 1, 2023 | 677006000 | 27913000 |
| Monday, January 1, 2024 | 696905000 | 33331000 |
Igniting the spark of knowledge
In the world of corporate finance, understanding operational costs is crucial for evaluating a company's efficiency. This analysis compares the Selling, General, and Administrative (SG&A) expenses of AMETEK, Inc. and Expeditors International of Washington, Inc. from 2014 to 2023. Over this period, AMETEK's SG&A expenses have shown a steady increase, rising by approximately 46% from 2014 to 2023. In contrast, Expeditors International experienced a more volatile trend, with a notable dip in 2020, where expenses fell by over 50% compared to 2019. By 2023, their expenses had partially recovered, yet remained 27% lower than their 2018 peak. This divergence highlights the differing strategic approaches and market conditions faced by these companies. Such insights are invaluable for investors and analysts seeking to understand the financial health and operational strategies of these industry players.
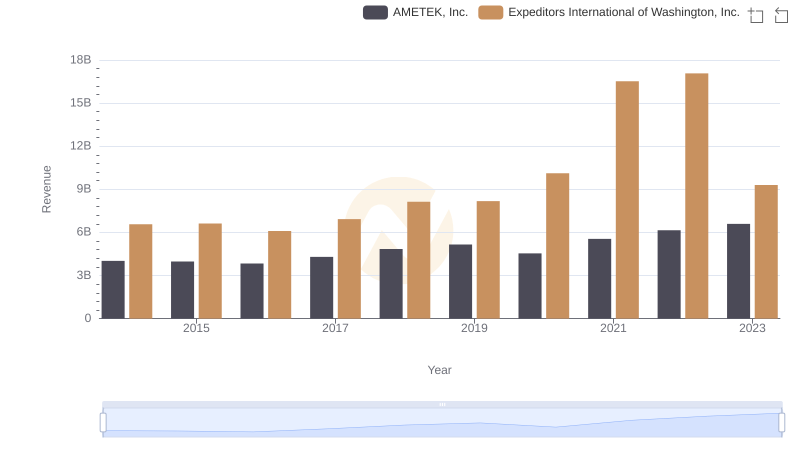
AMETEK, Inc. and Expeditors International of Washington, Inc.: A Comprehensive Revenue Analysis
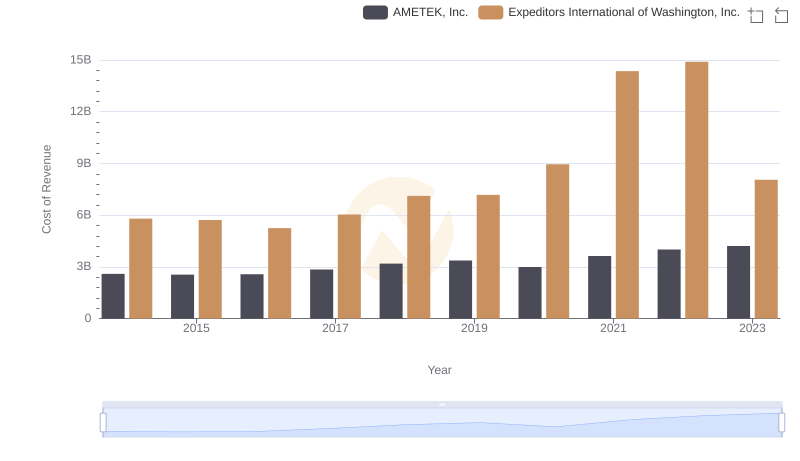
Cost of Revenue Comparison: AMETEK, Inc. vs Expeditors International of Washington, Inc.
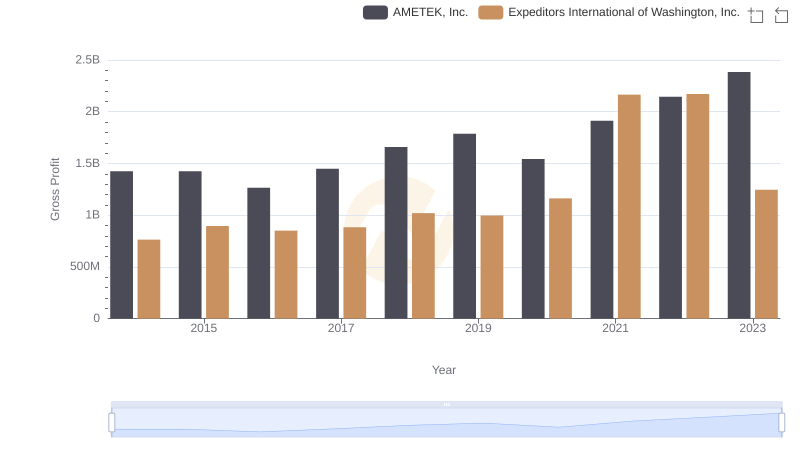
AMETEK, Inc. vs Expeditors International of Washington, Inc.: A Gross Profit Performance Breakdown
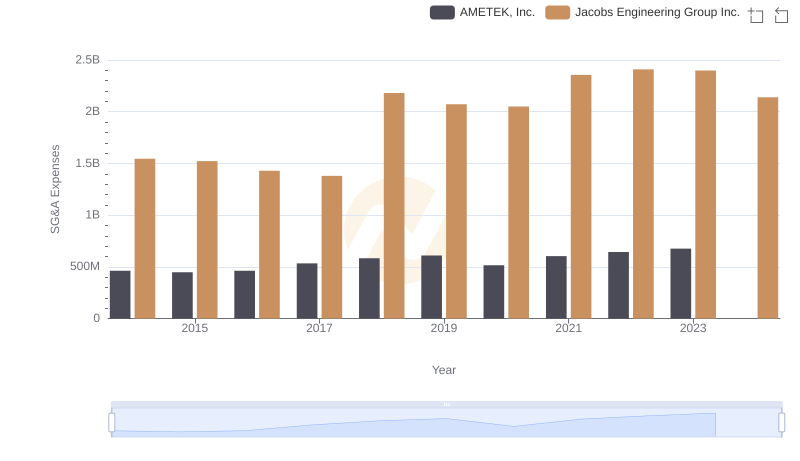
Who Optimizes SG&A Costs Better? AMETEK, Inc. or Jacobs Engineering Group Inc.
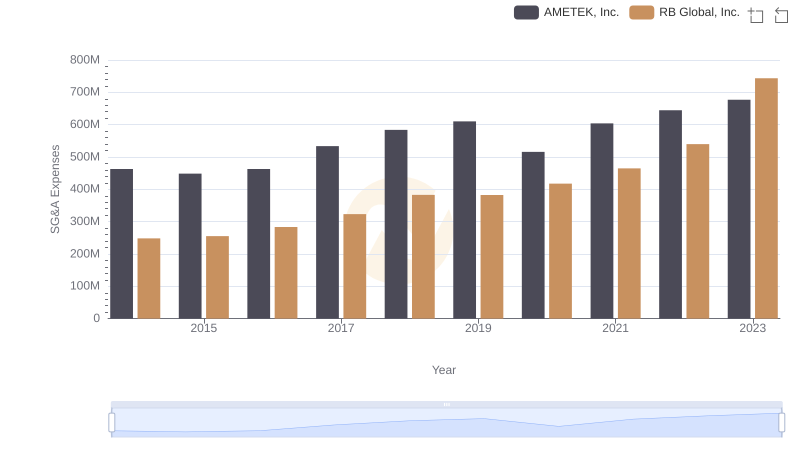
AMETEK, Inc. and RB Global, Inc.: SG&A Spending Patterns Compared
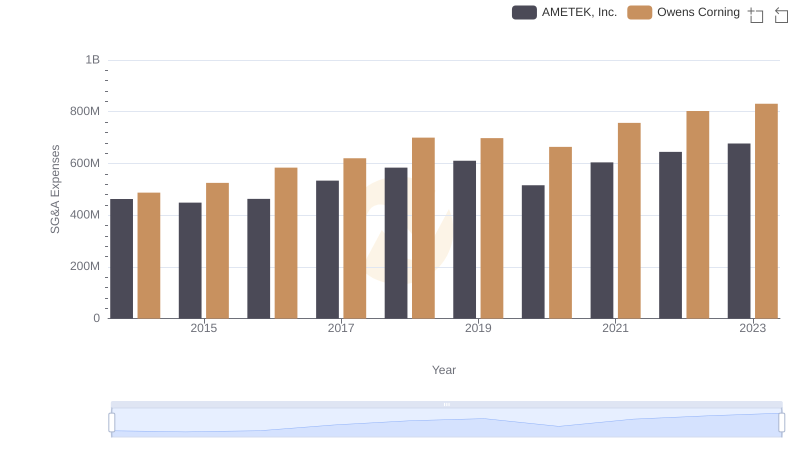
Comparing SG&A Expenses: AMETEK, Inc. vs Owens Corning Trends and Insights
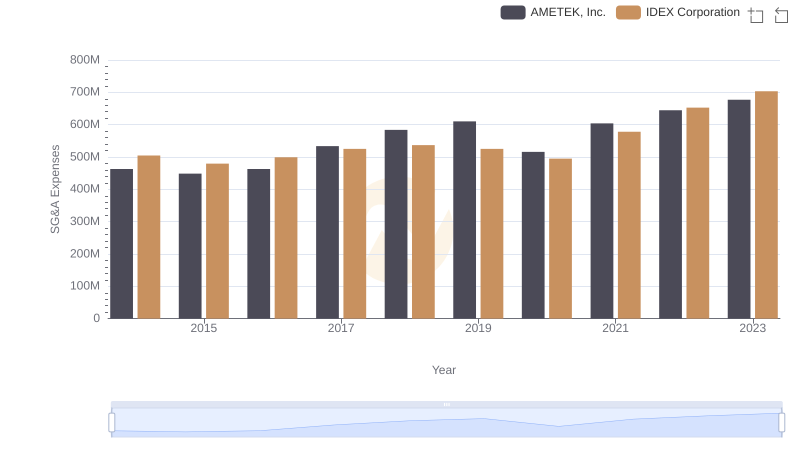
AMETEK, Inc. or IDEX Corporation: Who Manages SG&A Costs Better?
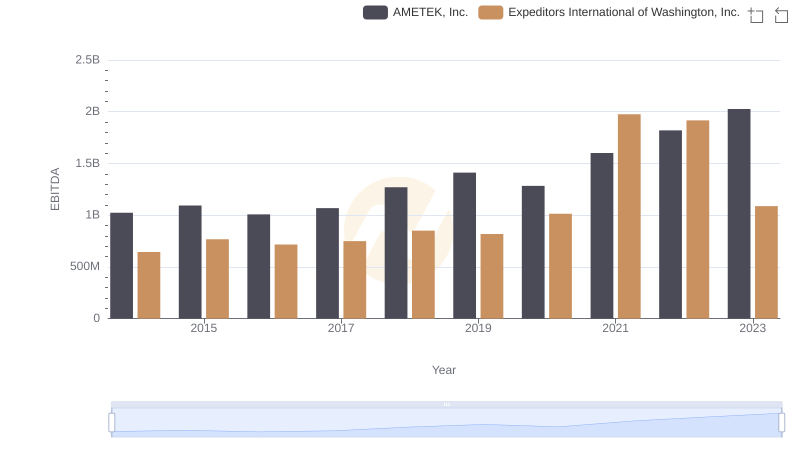
AMETEK, Inc. and Expeditors International of Washington, Inc.: A Detailed Examination of EBITDA Performance
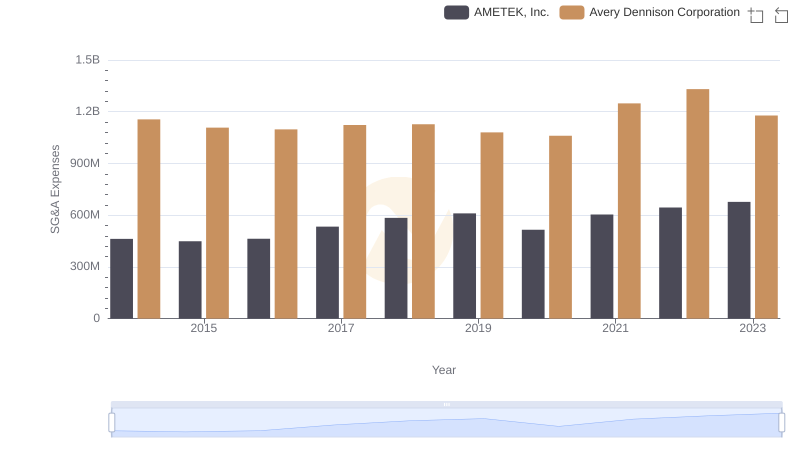
Cost Management Insights: SG&A Expenses for AMETEK, Inc. and Avery Dennison Corporation
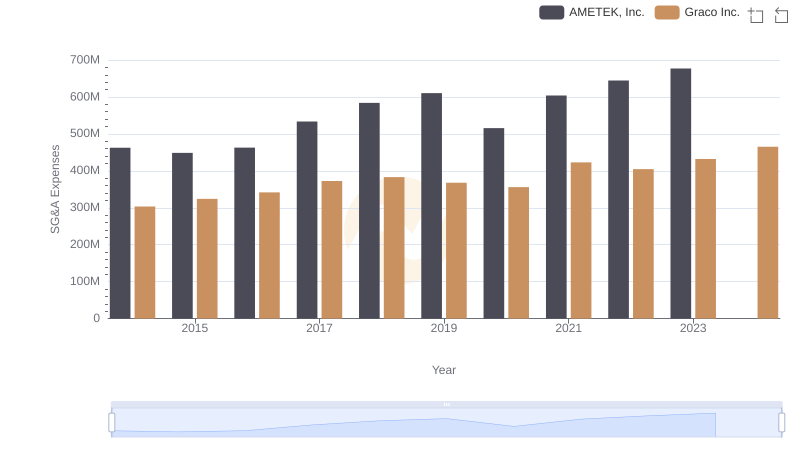
AMETEK, Inc. or Graco Inc.: Who Manages SG&A Costs Better?