| __timestamp | AMETEK, Inc. | Stanley Black & Decker, Inc. |
|---|---|---|
| Wednesday, January 1, 2014 | 2597017000 | 7235900000 |
| Thursday, January 1, 2015 | 2549280000 | 7099800000 |
| Friday, January 1, 2016 | 2575220000 | 7139700000 |
| Sunday, January 1, 2017 | 2851431000 | 7969200000 |
| Monday, January 1, 2018 | 3186310000 | 9080500000 |
| Tuesday, January 1, 2019 | 3370897000 | 9636700000 |
| Wednesday, January 1, 2020 | 2996515000 | 9566700000 |
| Friday, January 1, 2021 | 3633900000 | 10423000000 |
| Saturday, January 1, 2022 | 4005261000 | 12663300000 |
| Sunday, January 1, 2023 | 4212484999 | 11683100000 |
| Monday, January 1, 2024 | 0 | 10851300000 |
Cracking the code
In the world of industrial manufacturing, efficiency is key. Over the past decade, AMETEK, Inc. and Stanley Black & Decker, Inc. have showcased contrasting trends in their cost of revenue. From 2014 to 2023, AMETEK's cost of revenue increased by approximately 62%, reflecting a strategic expansion and investment in quality. Meanwhile, Stanley Black & Decker saw a 61% rise, peaking in 2022, before a slight dip in 2023. This fluctuation highlights the challenges of maintaining cost efficiency amidst global economic shifts. Notably, AMETEK's cost efficiency improved significantly in 2023, surpassing its previous records. As these industry leaders navigate the complexities of the modern market, their financial strategies offer valuable insights into the balance between growth and cost management. This comparison not only underscores their resilience but also sets a benchmark for others in the sector.

AMETEK, Inc. vs Stanley Black & Decker, Inc.: Annual Revenue Growth Compared
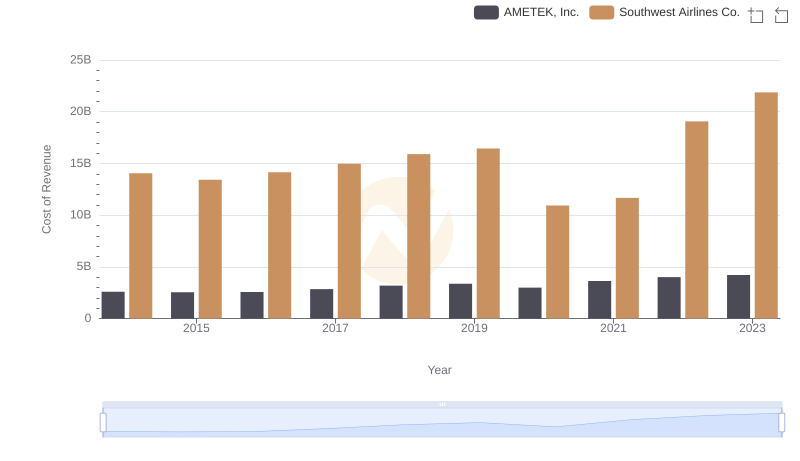
Cost Insights: Breaking Down AMETEK, Inc. and Southwest Airlines Co.'s Expenses
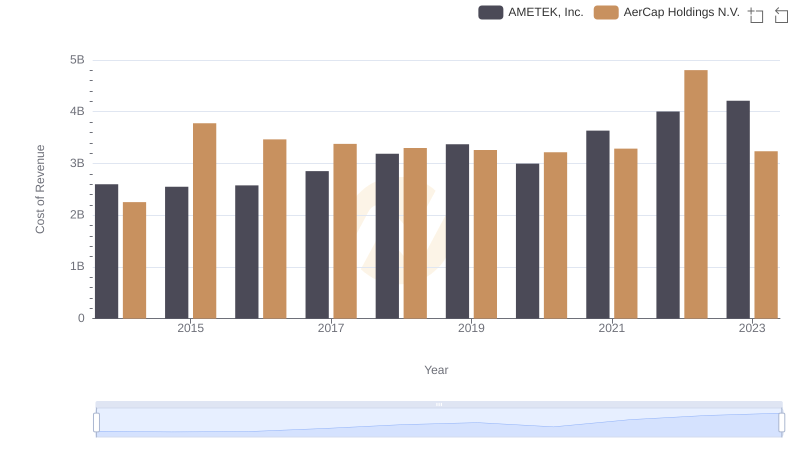
Cost of Revenue: Key Insights for AMETEK, Inc. and AerCap Holdings N.V.
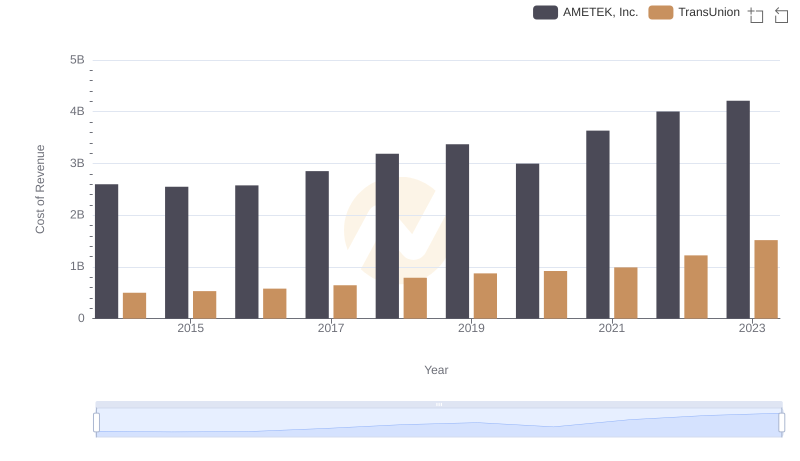
Cost of Revenue: Key Insights for AMETEK, Inc. and TransUnion

AMETEK, Inc. and Stanley Black & Decker, Inc.: SG&A Spending Patterns Compared

Comparative EBITDA Analysis: AMETEK, Inc. vs Stanley Black & Decker, Inc.
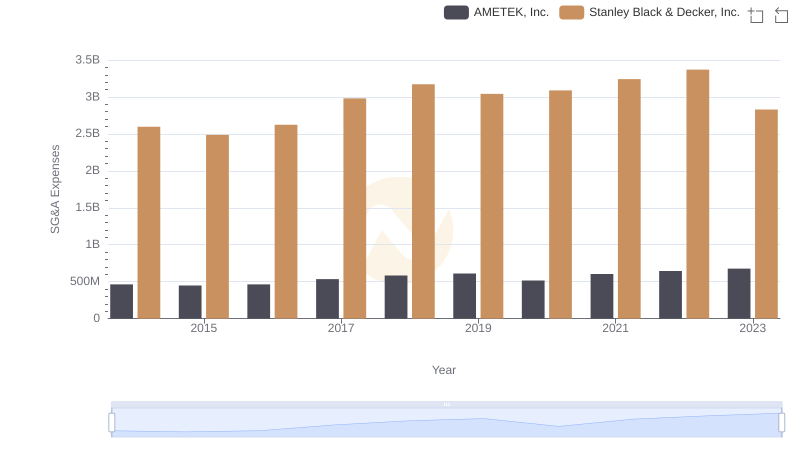
AMETEK, Inc. and Stanley Black & Decker, Inc.: SG&A Spending Patterns Compared
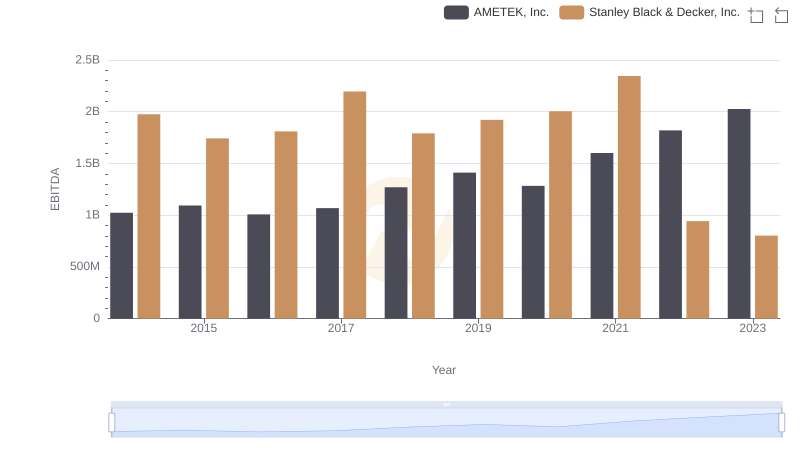
Professional EBITDA Benchmarking: AMETEK, Inc. vs Stanley Black & Decker, Inc.