| __timestamp | AMETEK, Inc. | J.B. Hunt Transport Services, Inc. |
|---|---|---|
| Wednesday, January 1, 2014 | 2597017000 | 5124095000 |
| Thursday, January 1, 2015 | 2549280000 | 5041472000 |
| Friday, January 1, 2016 | 2575220000 | 5369826000 |
| Sunday, January 1, 2017 | 2851431000 | 5990275000 |
| Monday, January 1, 2018 | 3186310000 | 7255657000 |
| Tuesday, January 1, 2019 | 3370897000 | 7659003000 |
| Wednesday, January 1, 2020 | 2996515000 | 8186697000 |
| Friday, January 1, 2021 | 3633900000 | 10298483000 |
| Saturday, January 1, 2022 | 4005261000 | 12341472000 |
| Sunday, January 1, 2023 | 4212484999 | 10433277000 |
| Monday, January 1, 2024 | 0 |
Unlocking the unknown
In the ever-evolving landscape of American industry, understanding cost dynamics is crucial. This analysis delves into the cost of revenue trends for two major players: AMETEK, Inc., a leader in electronic instruments, and J.B. Hunt Transport Services, Inc., a giant in transportation logistics. From 2014 to 2023, AMETEK's cost of revenue grew by approximately 62%, reflecting its strategic investments and market expansion. Meanwhile, J.B. Hunt saw a staggering 104% increase, underscoring its aggressive growth in logistics and transportation services. Notably, 2022 marked a peak year for both companies, with J.B. Hunt's costs reaching over 12 billion, a testament to its expansive operations. This comparative analysis highlights the distinct growth trajectories and strategic priorities of these industry titans, offering valuable insights for investors and market analysts alike.
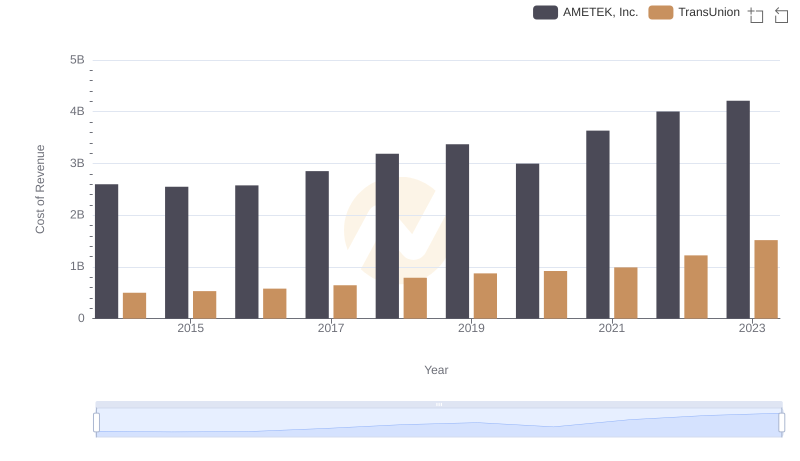
Cost of Revenue: Key Insights for AMETEK, Inc. and TransUnion
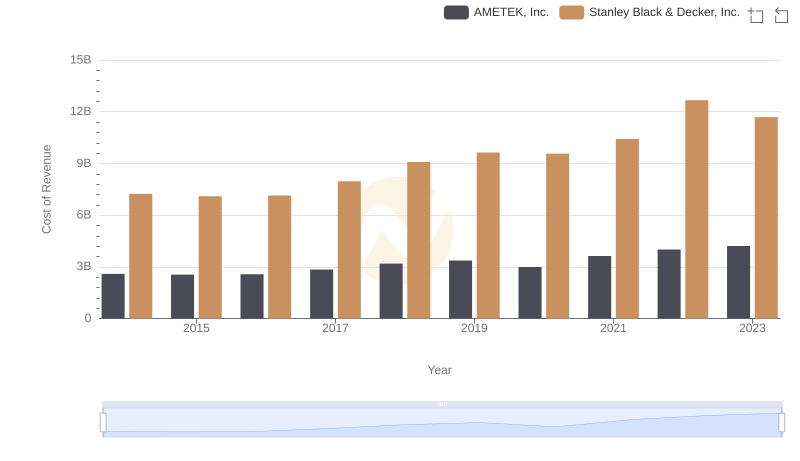
Comparing Cost of Revenue Efficiency: AMETEK, Inc. vs Stanley Black & Decker, Inc.
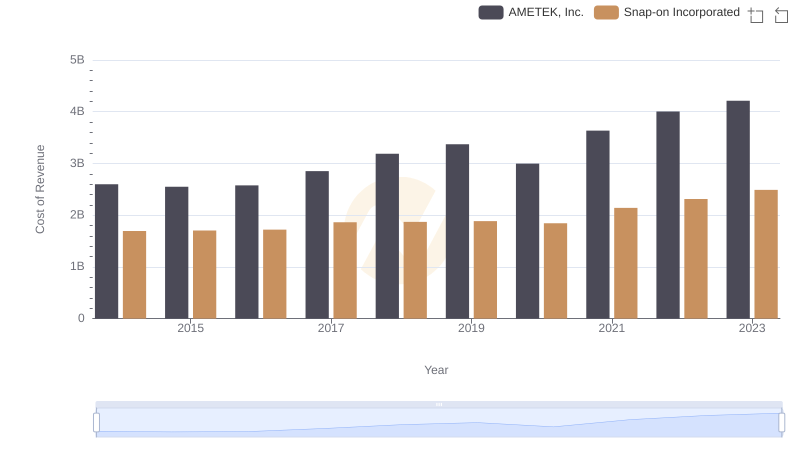
Cost of Revenue Trends: AMETEK, Inc. vs Snap-on Incorporated
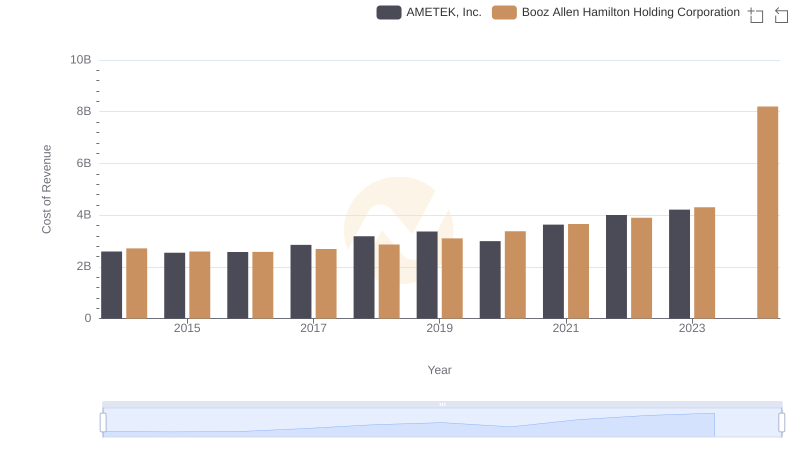
Cost of Revenue Comparison: AMETEK, Inc. vs Booz Allen Hamilton Holding Corporation
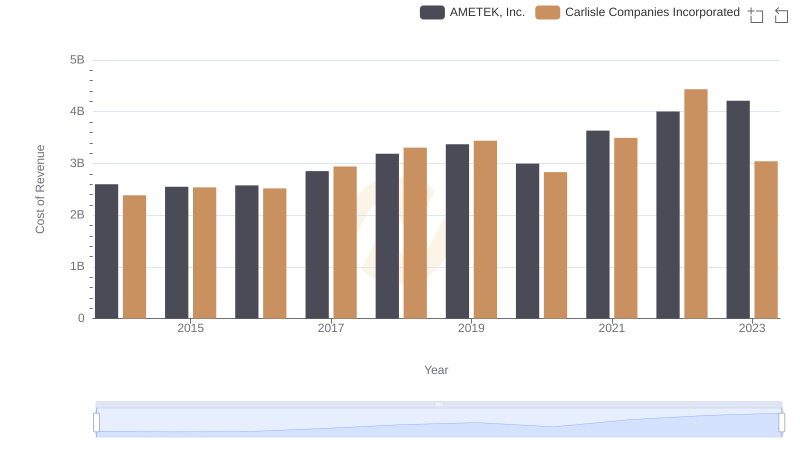
Cost of Revenue Comparison: AMETEK, Inc. vs Carlisle Companies Incorporated
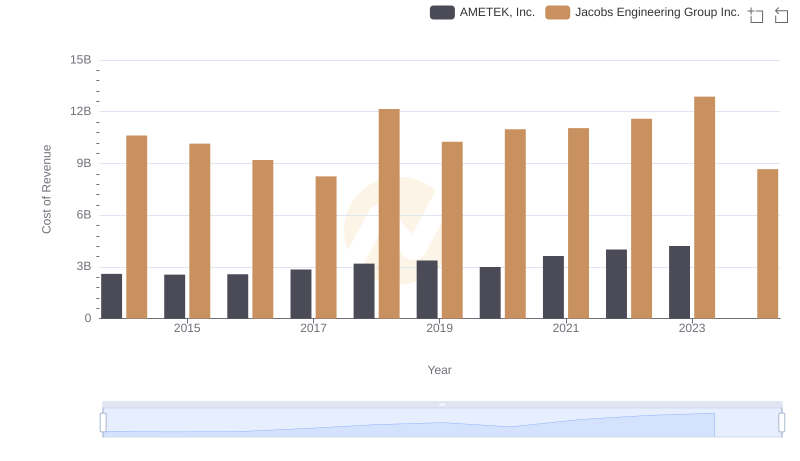
AMETEK, Inc. vs Jacobs Engineering Group Inc.: Efficiency in Cost of Revenue Explored
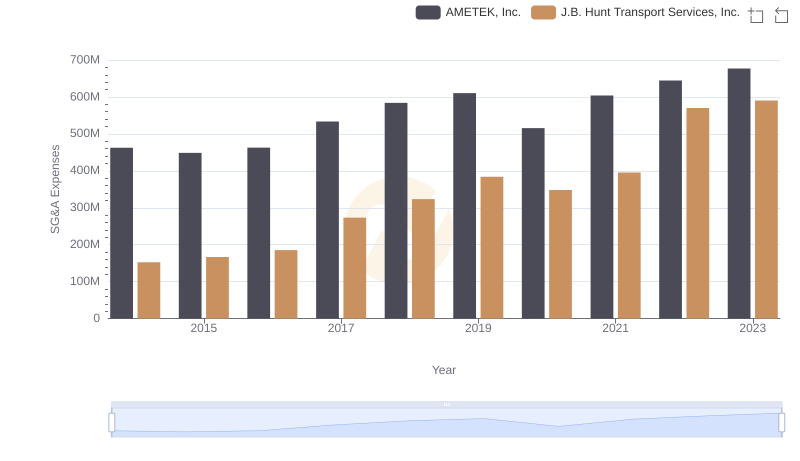
AMETEK, Inc. and J.B. Hunt Transport Services, Inc.: SG&A Spending Patterns Compared
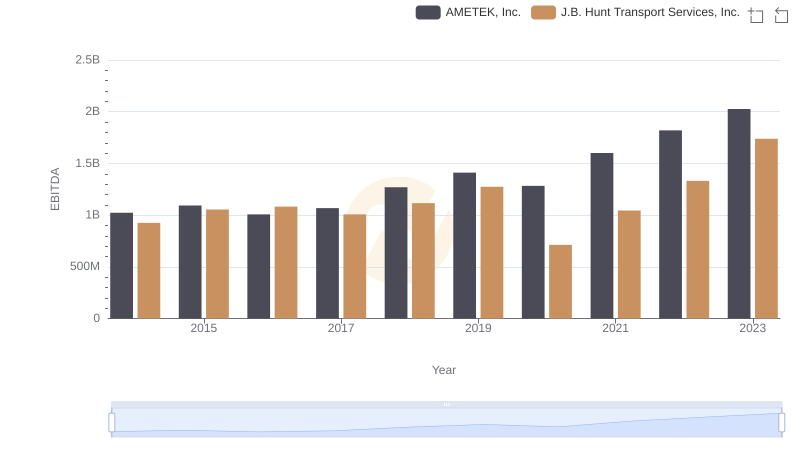
AMETEK, Inc. and J.B. Hunt Transport Services, Inc.: A Detailed Examination of EBITDA Performance