| __timestamp | Dover Corporation | Westinghouse Air Brake Technologies Corporation |
|---|---|---|
| Wednesday, January 1, 2014 | 4778479000 | 2130920000 |
| Thursday, January 1, 2015 | 4388167000 | 2281845000 |
| Friday, January 1, 2016 | 4322373000 | 2029647000 |
| Sunday, January 1, 2017 | 4940059000 | 2841159000 |
| Monday, January 1, 2018 | 4432562000 | 3151816000 |
| Tuesday, January 1, 2019 | 4515459000 | 6122400000 |
| Wednesday, January 1, 2020 | 4209741000 | 5657400000 |
| Friday, January 1, 2021 | 4937295000 | 5687000000 |
| Saturday, January 1, 2022 | 5444532000 | 6070000000 |
| Sunday, January 1, 2023 | 5353501000 | 6733000000 |
| Monday, January 1, 2024 | 4787288000 | 7021000000 |
Cracking the code
In the ever-evolving landscape of industrial manufacturing, understanding cost structures is pivotal. This analysis delves into the cost of revenue trends for two industry stalwarts: Dover Corporation and Westinghouse Air Brake Technologies Corporation, from 2014 to 2023. Over this decade, Dover Corporation's cost of revenue exhibited a steady growth, peaking in 2022 with a 14% increase from its 2014 figures. Meanwhile, Westinghouse Air Brake Technologies Corporation showcased a more dynamic trajectory, with a remarkable 216% surge in 2023 compared to 2014. This stark contrast highlights differing strategic approaches in managing operational expenses. While Dover's costs remained relatively stable, Westinghouse's significant rise in 2019 and subsequent years suggests aggressive expansion or increased production capabilities. Such insights are invaluable for investors and industry analysts aiming to decode the financial health and strategic direction of these corporations.
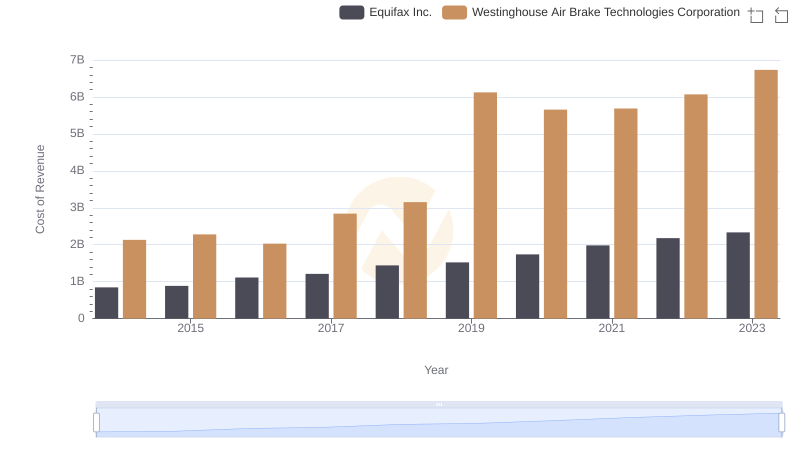
Westinghouse Air Brake Technologies Corporation vs Equifax Inc.: Efficiency in Cost of Revenue Explored
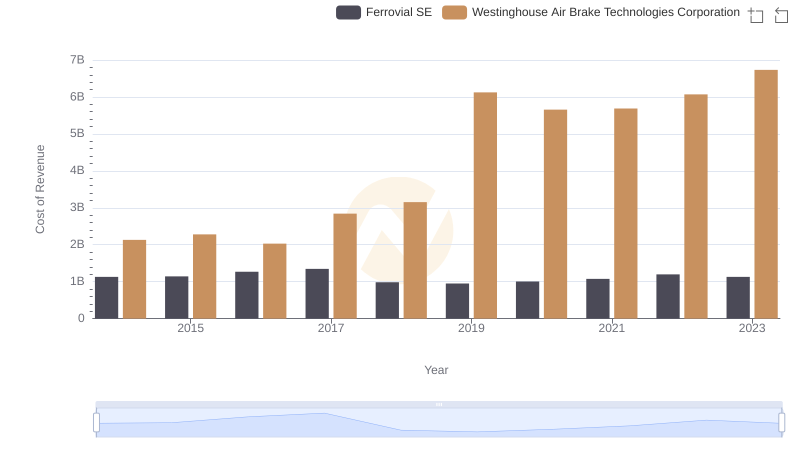
Comparing Cost of Revenue Efficiency: Westinghouse Air Brake Technologies Corporation vs Ferrovial SE

Cost of Revenue Trends: Westinghouse Air Brake Technologies Corporation vs Global Payments Inc.
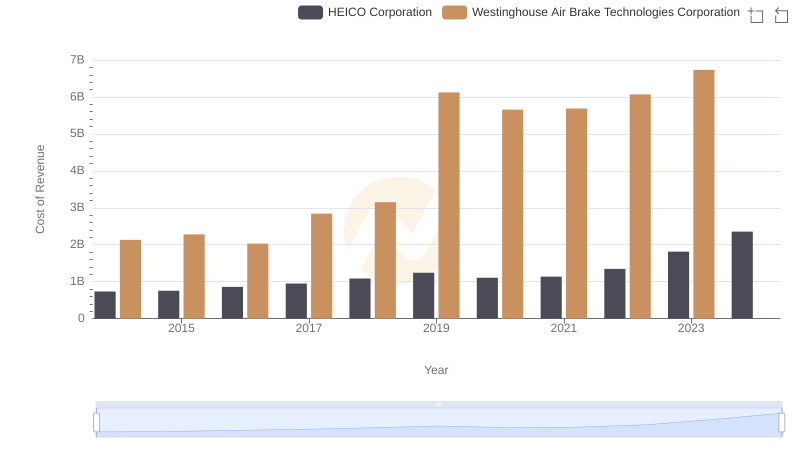
Westinghouse Air Brake Technologies Corporation vs HEICO Corporation: Efficiency in Cost of Revenue Explored
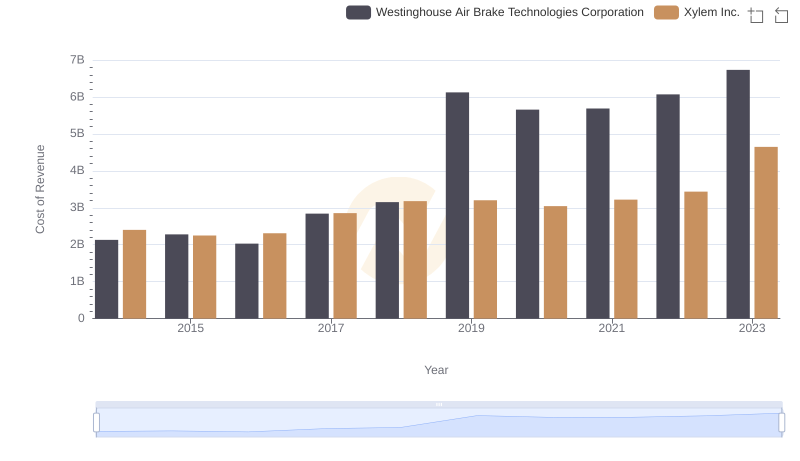
Cost Insights: Breaking Down Westinghouse Air Brake Technologies Corporation and Xylem Inc.'s Expenses
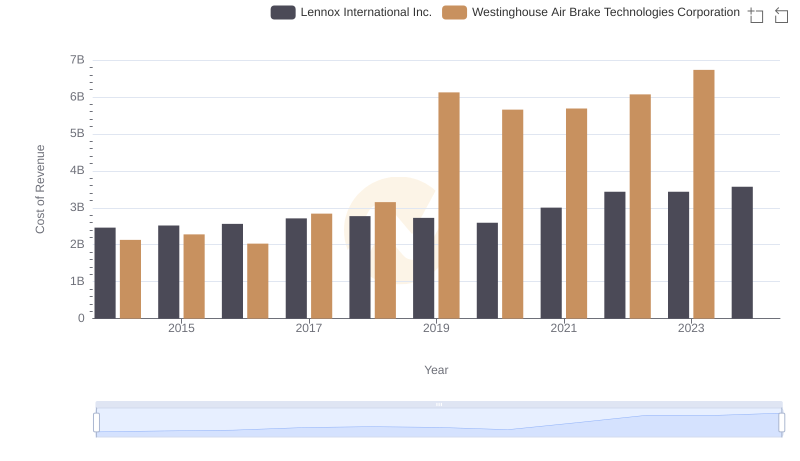
Westinghouse Air Brake Technologies Corporation vs Lennox International Inc.: Efficiency in Cost of Revenue Explored
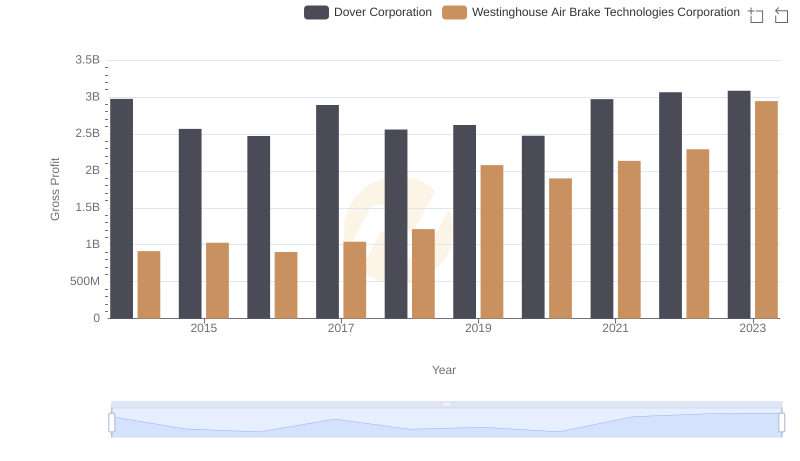
Gross Profit Comparison: Westinghouse Air Brake Technologies Corporation and Dover Corporation Trends
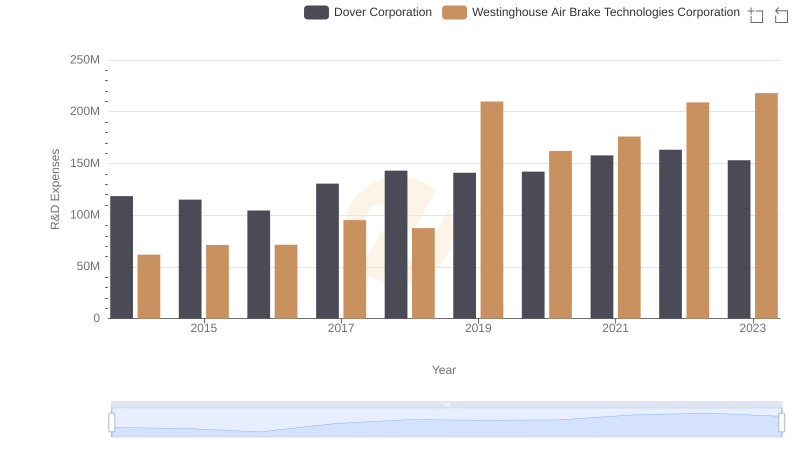
R&D Insights: How Westinghouse Air Brake Technologies Corporation and Dover Corporation Allocate Funds

Comparative EBITDA Analysis: Westinghouse Air Brake Technologies Corporation vs Dover Corporation