| __timestamp | Lennox International Inc. | Westinghouse Air Brake Technologies Corporation |
|---|---|---|
| Wednesday, January 1, 2014 | 2464100000 | 2130920000 |
| Thursday, January 1, 2015 | 2520000000 | 2281845000 |
| Friday, January 1, 2016 | 2565100000 | 2029647000 |
| Sunday, January 1, 2017 | 2714400000 | 2841159000 |
| Monday, January 1, 2018 | 2772700000 | 3151816000 |
| Tuesday, January 1, 2019 | 2727400000 | 6122400000 |
| Wednesday, January 1, 2020 | 2594000000 | 5657400000 |
| Friday, January 1, 2021 | 3005700000 | 5687000000 |
| Saturday, January 1, 2022 | 3433700000 | 6070000000 |
| Sunday, January 1, 2023 | 3434100000 | 6733000000 |
| Monday, January 1, 2024 | 3569400000 | 7021000000 |
Unleashing the power of data
In the competitive landscape of industrial manufacturing, cost efficiency is paramount. Westinghouse Air Brake Technologies Corporation and Lennox International Inc. have been pivotal players in this arena. From 2014 to 2023, Lennox International Inc. demonstrated a steady increase in cost of revenue, peaking at approximately $3.57 billion in 2023, marking a 45% rise from 2014. Meanwhile, Westinghouse Air Brake Technologies Corporation showcased a more volatile trajectory, with a significant surge in 2019, reaching a peak of $6.73 billion in 2023, a staggering 216% increase from 2014.
This data highlights the contrasting strategies of these corporations in managing their cost structures. While Lennox International Inc. maintained a consistent growth, Westinghouse Air Brake Technologies Corporation experienced fluctuations, possibly indicating strategic shifts or market responses. The absence of 2024 data for Westinghouse suggests potential changes or reporting delays, inviting further analysis.

Cost of Revenue Trends: Westinghouse Air Brake Technologies Corporation vs Global Payments Inc.
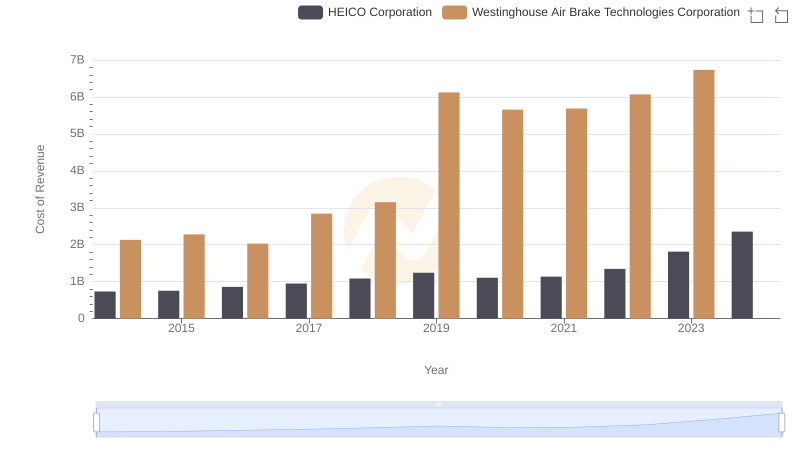
Westinghouse Air Brake Technologies Corporation vs HEICO Corporation: Efficiency in Cost of Revenue Explored
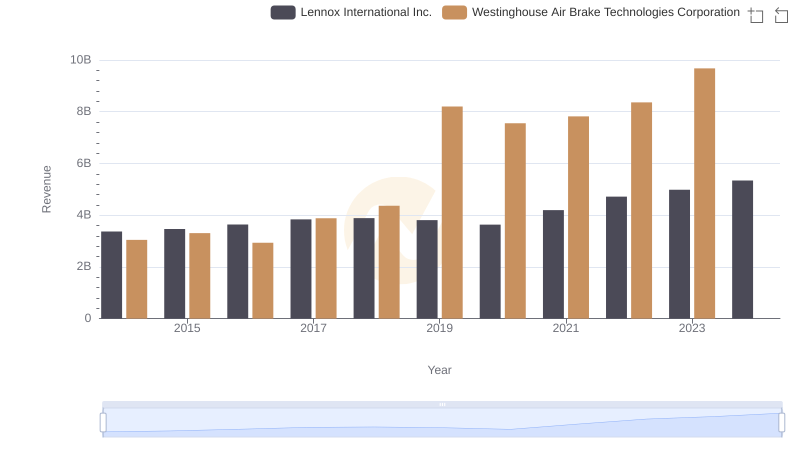
Westinghouse Air Brake Technologies Corporation vs Lennox International Inc.: Examining Key Revenue Metrics
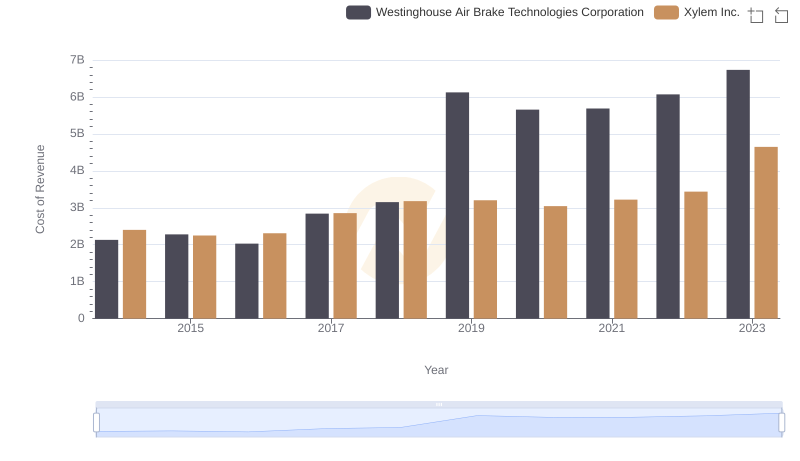
Cost Insights: Breaking Down Westinghouse Air Brake Technologies Corporation and Xylem Inc.'s Expenses
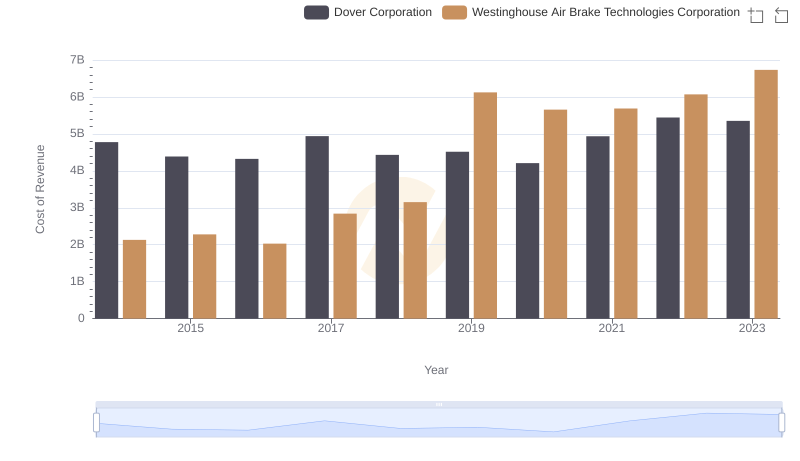
Cost Insights: Breaking Down Westinghouse Air Brake Technologies Corporation and Dover Corporation's Expenses
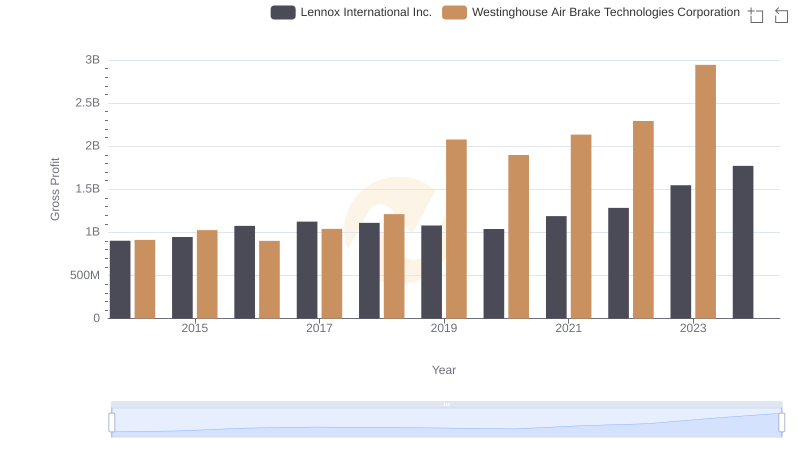
Gross Profit Comparison: Westinghouse Air Brake Technologies Corporation and Lennox International Inc. Trends
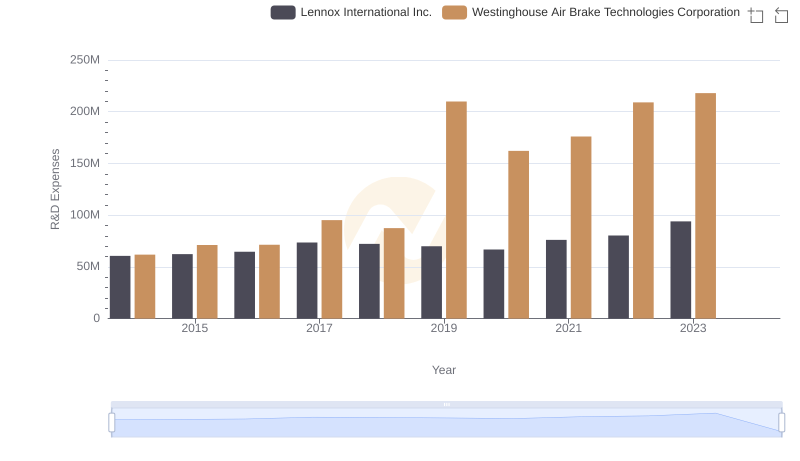
Research and Development Expenses Breakdown: Westinghouse Air Brake Technologies Corporation vs Lennox International Inc.
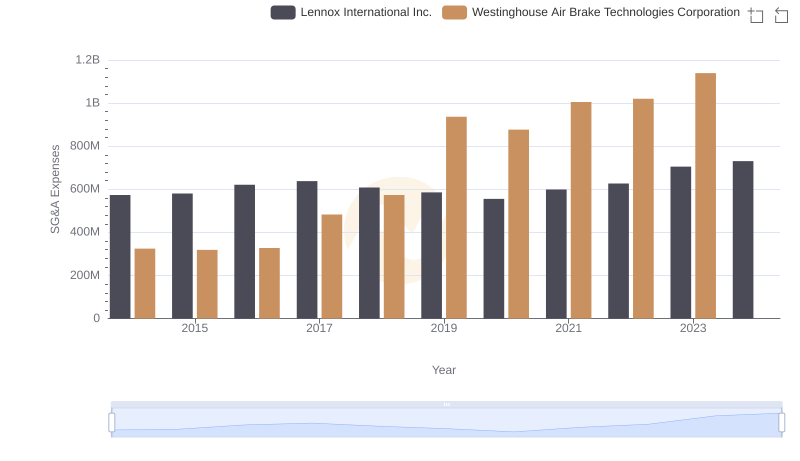
SG&A Efficiency Analysis: Comparing Westinghouse Air Brake Technologies Corporation and Lennox International Inc.
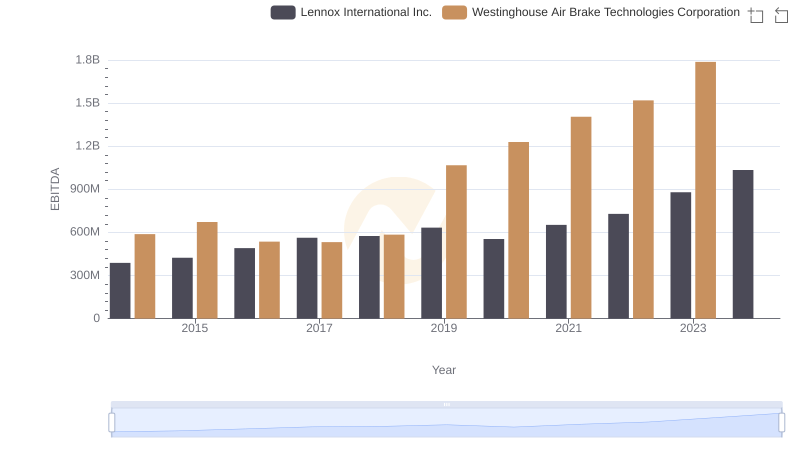
Westinghouse Air Brake Technologies Corporation vs Lennox International Inc.: In-Depth EBITDA Performance Comparison