| __timestamp | Westinghouse Air Brake Technologies Corporation | Xylem Inc. |
|---|---|---|
| Wednesday, January 1, 2014 | 2130920000 | 2403000000 |
| Thursday, January 1, 2015 | 2281845000 | 2249000000 |
| Friday, January 1, 2016 | 2029647000 | 2310000000 |
| Sunday, January 1, 2017 | 2841159000 | 2856000000 |
| Monday, January 1, 2018 | 3151816000 | 3181000000 |
| Tuesday, January 1, 2019 | 6122400000 | 3203000000 |
| Wednesday, January 1, 2020 | 5657400000 | 3046000000 |
| Friday, January 1, 2021 | 5687000000 | 3220000000 |
| Saturday, January 1, 2022 | 6070000000 | 3438000000 |
| Sunday, January 1, 2023 | 6733000000 | 4647000000 |
| Monday, January 1, 2024 | 7021000000 |
Unveiling the hidden dimensions of data
In the ever-evolving landscape of industrial technology, understanding cost structures is pivotal. Over the past decade, Westinghouse Air Brake Technologies Corporation and Xylem Inc. have showcased intriguing financial trajectories. From 2014 to 2023, Westinghouse's cost of revenue surged by approximately 216%, peaking in 2023. This growth reflects strategic expansions and market adaptations. Meanwhile, Xylem Inc. experienced a more modest increase of around 93% in the same period, highlighting its steady yet resilient market presence. Notably, 2019 marked a significant leap for Westinghouse, with costs nearly doubling, possibly due to acquisitions or increased production demands. In contrast, Xylem's costs remained relatively stable, with a notable rise in 2023, suggesting a strategic pivot or market expansion. These insights offer a window into the financial strategies and market responses of two industrial giants, providing valuable lessons for investors and industry analysts alike.
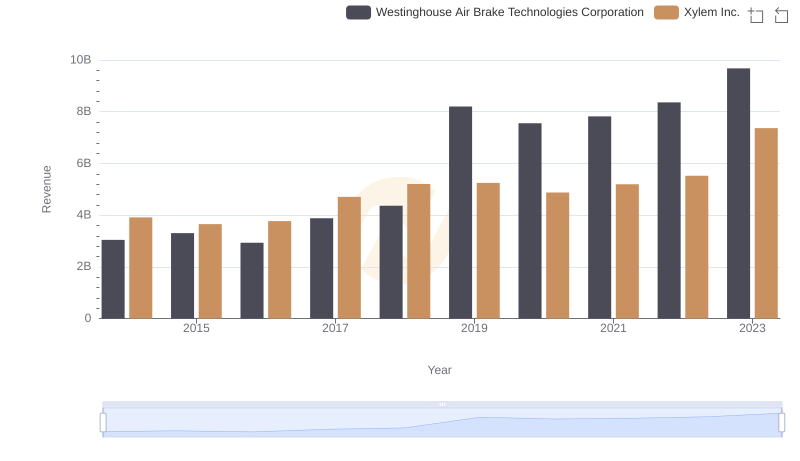
Who Generates More Revenue? Westinghouse Air Brake Technologies Corporation or Xylem Inc.

Cost of Revenue: Key Insights for Westinghouse Air Brake Technologies Corporation and United Airlines Holdings, Inc.
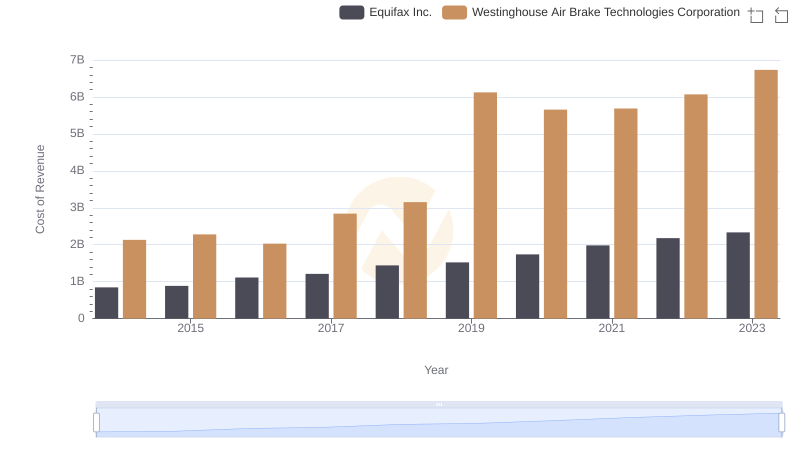
Westinghouse Air Brake Technologies Corporation vs Equifax Inc.: Efficiency in Cost of Revenue Explored
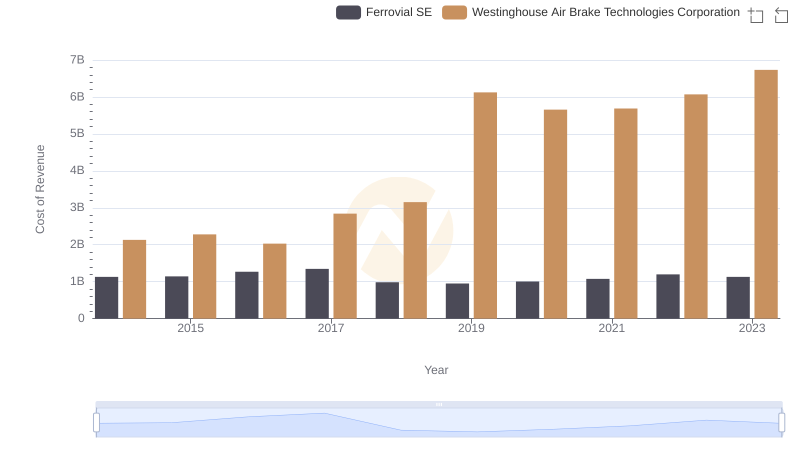
Comparing Cost of Revenue Efficiency: Westinghouse Air Brake Technologies Corporation vs Ferrovial SE

Cost of Revenue Trends: Westinghouse Air Brake Technologies Corporation vs Global Payments Inc.
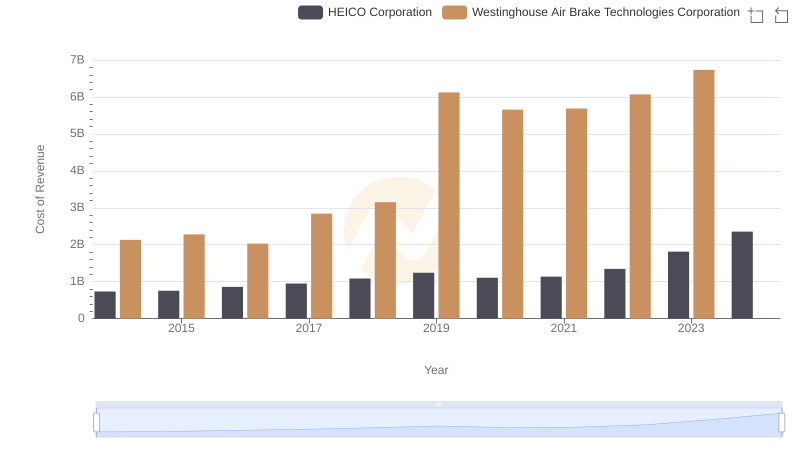
Westinghouse Air Brake Technologies Corporation vs HEICO Corporation: Efficiency in Cost of Revenue Explored
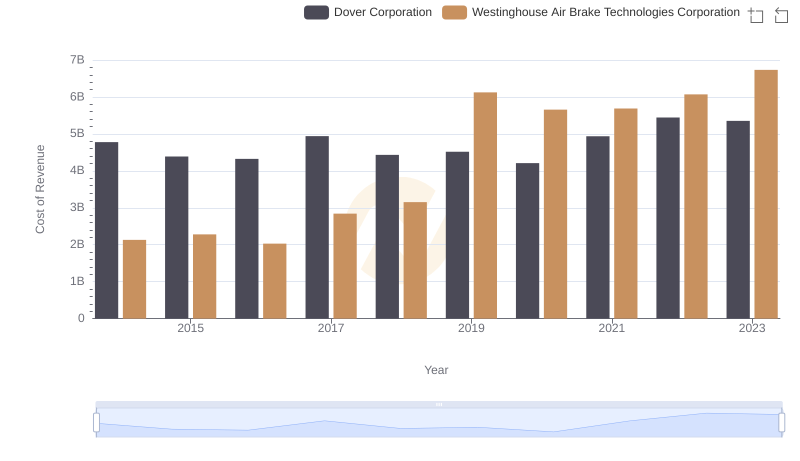
Cost Insights: Breaking Down Westinghouse Air Brake Technologies Corporation and Dover Corporation's Expenses
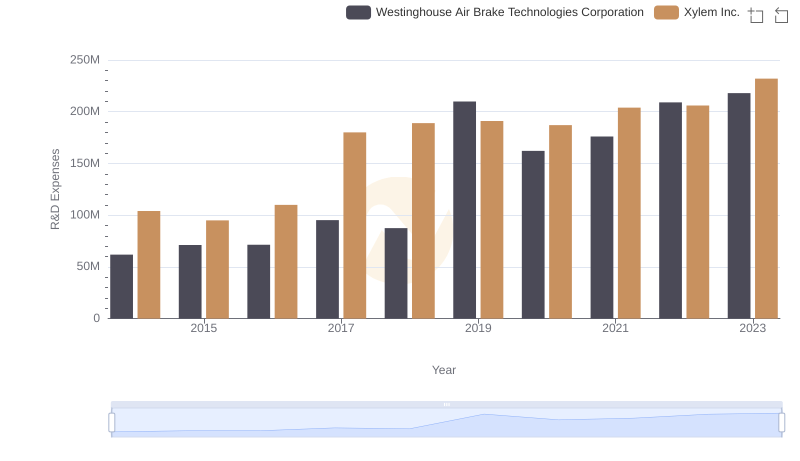
Westinghouse Air Brake Technologies Corporation or Xylem Inc.: Who Invests More in Innovation?
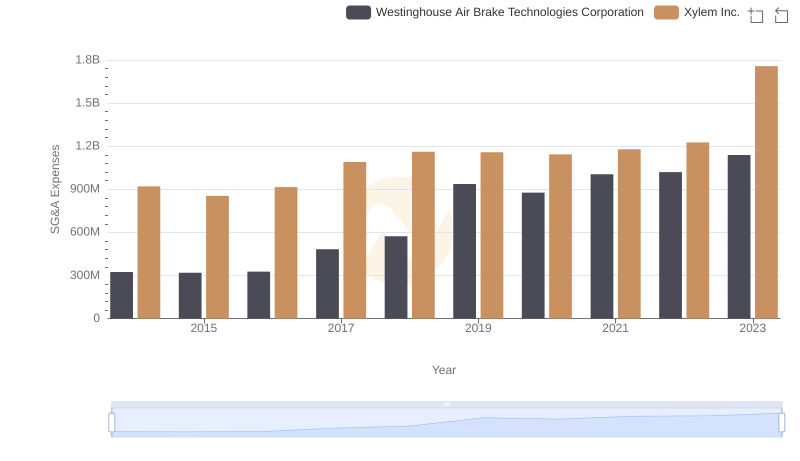
Who Optimizes SG&A Costs Better? Westinghouse Air Brake Technologies Corporation or Xylem Inc.
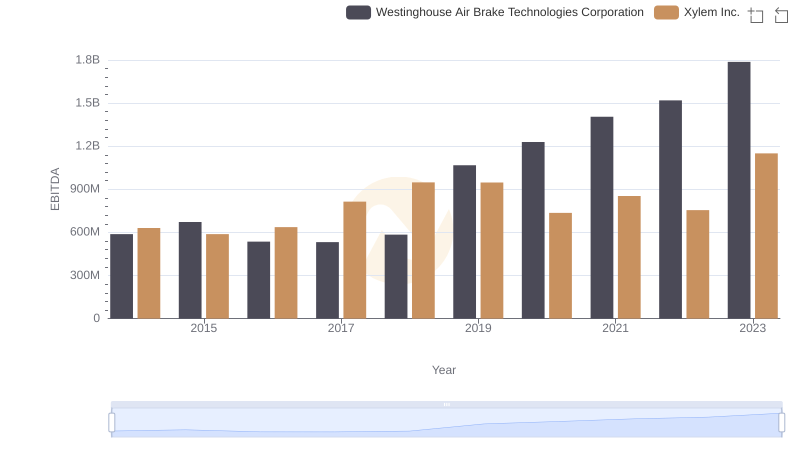
A Professional Review of EBITDA: Westinghouse Air Brake Technologies Corporation Compared to Xylem Inc.