| __timestamp | Dover Corporation | Westinghouse Air Brake Technologies Corporation |
|---|---|---|
| Wednesday, January 1, 2014 | 1533084000 | 588370000 |
| Thursday, January 1, 2015 | 1259375000 | 672301000 |
| Friday, January 1, 2016 | 1186472000 | 535893000 |
| Sunday, January 1, 2017 | 1304041000 | 532795000 |
| Monday, January 1, 2018 | 1138930000 | 584199000 |
| Tuesday, January 1, 2019 | 1241114000 | 1067300000 |
| Wednesday, January 1, 2020 | 1232722000 | 1229400000 |
| Friday, January 1, 2021 | 1797268000 | 1405000000 |
| Saturday, January 1, 2022 | 1711499000 | 1519000000 |
| Sunday, January 1, 2023 | 1718774000 | 1787000000 |
| Monday, January 1, 2024 | 1206355000 | 1609000000 |
Unleashing insights
In the ever-evolving landscape of industrial giants, the EBITDA performance of Westinghouse Air Brake Technologies Corporation and Dover Corporation from 2014 to 2023 offers a fascinating glimpse into their financial health. Over this period, Dover Corporation consistently outperformed Westinghouse Air Brake, with an average EBITDA approximately 42% higher. Notably, Dover's EBITDA peaked in 2021, reaching a remarkable 1.8 billion, while Westinghouse Air Brake saw its highest EBITDA in 2023 at 1.8 billion, marking a significant 204% increase from its 2014 figures.
The data reveals a compelling narrative of resilience and growth, particularly for Westinghouse Air Brake, which demonstrated a steady upward trajectory, especially post-2019. This trend underscores the company's strategic adaptations in a competitive market. Meanwhile, Dover's robust performance highlights its established market presence and operational efficiency. As these industrial titans continue to innovate, their financial journeys offer valuable insights into the broader economic landscape.
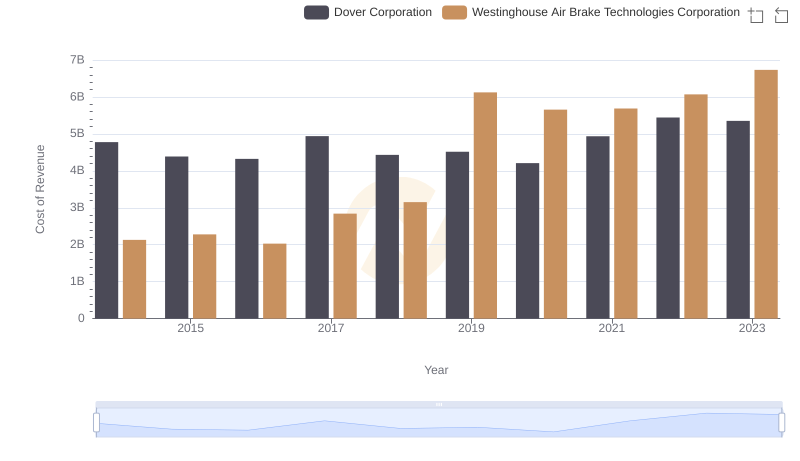
Cost Insights: Breaking Down Westinghouse Air Brake Technologies Corporation and Dover Corporation's Expenses
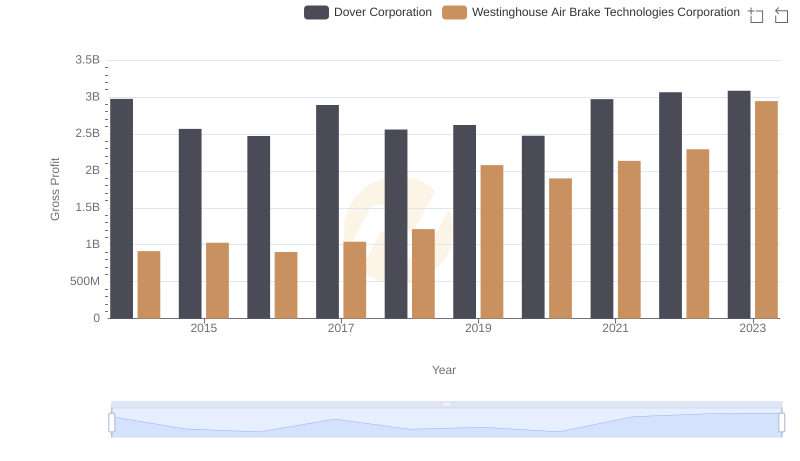
Gross Profit Comparison: Westinghouse Air Brake Technologies Corporation and Dover Corporation Trends
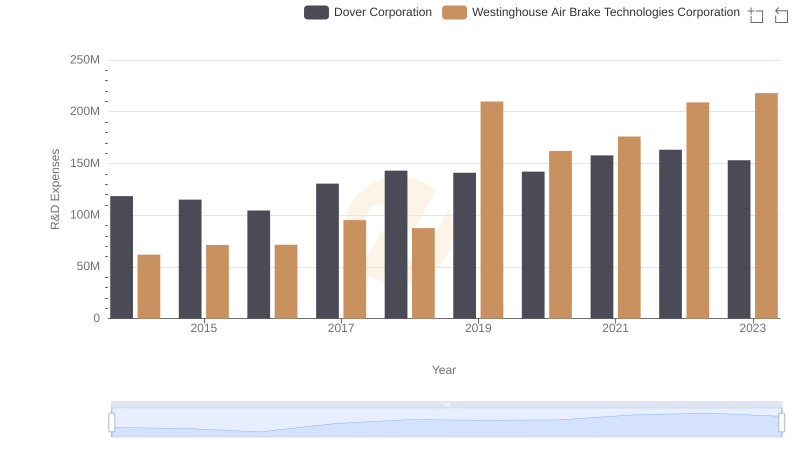
R&D Insights: How Westinghouse Air Brake Technologies Corporation and Dover Corporation Allocate Funds
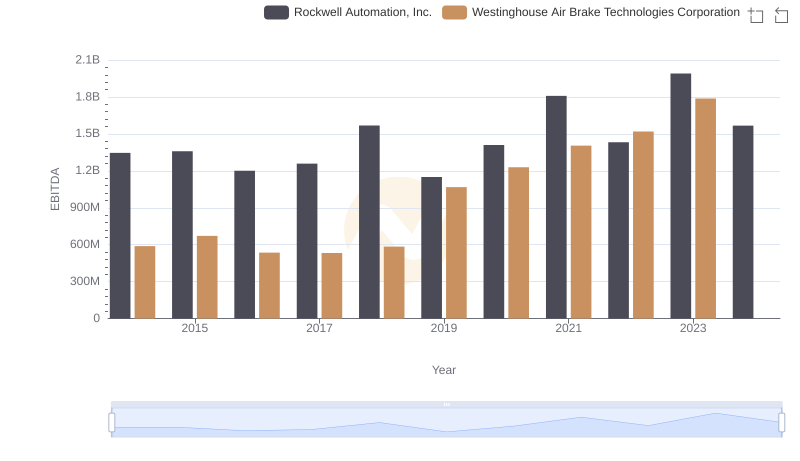
Westinghouse Air Brake Technologies Corporation and Rockwell Automation, Inc.: A Detailed Examination of EBITDA Performance
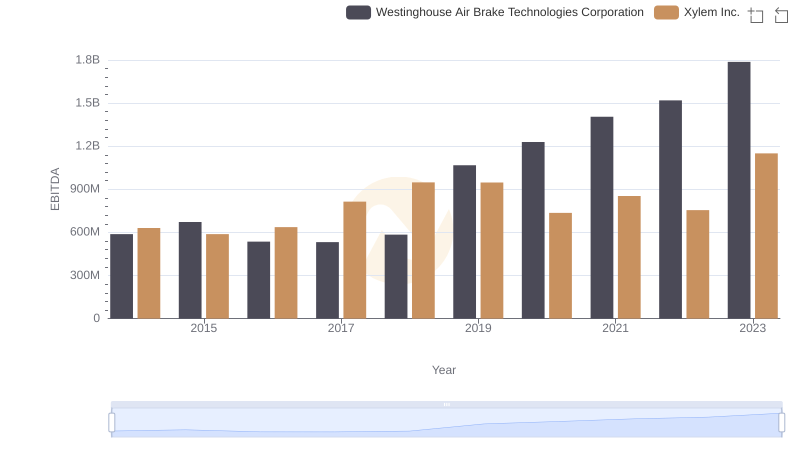
A Professional Review of EBITDA: Westinghouse Air Brake Technologies Corporation Compared to Xylem Inc.
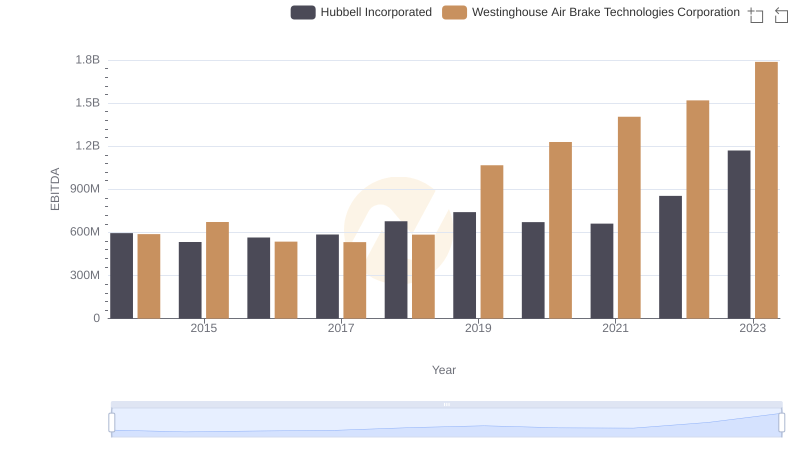
EBITDA Analysis: Evaluating Westinghouse Air Brake Technologies Corporation Against Hubbell Incorporated
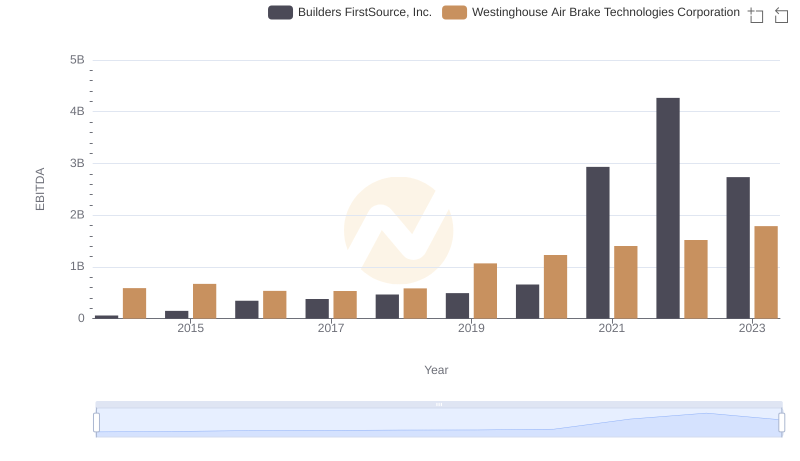
A Side-by-Side Analysis of EBITDA: Westinghouse Air Brake Technologies Corporation and Builders FirstSource, Inc.
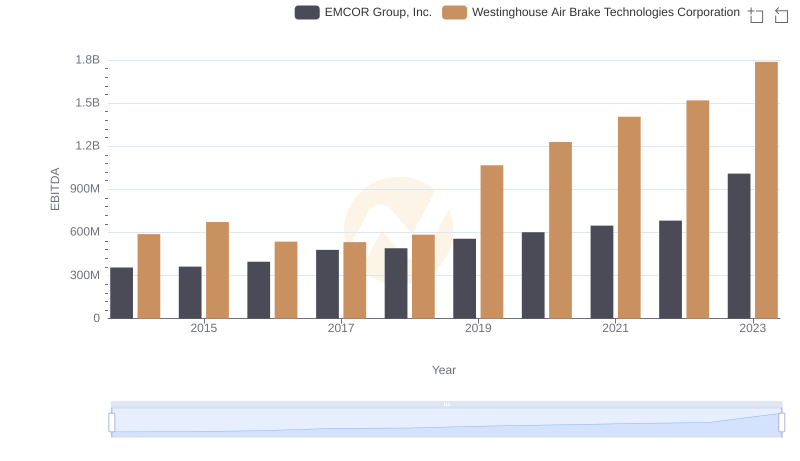
Professional EBITDA Benchmarking: Westinghouse Air Brake Technologies Corporation vs EMCOR Group, Inc.