| __timestamp | Saia, Inc. | Waste Connections, Inc. |
|---|---|---|
| Wednesday, January 1, 2014 | 37563000 | 229474000 |
| Thursday, January 1, 2015 | 26832000 | 237484000 |
| Friday, January 1, 2016 | 39625000 | 474263000 |
| Sunday, January 1, 2017 | 37162000 | 509638000 |
| Monday, January 1, 2018 | 38425000 | 524388000 |
| Tuesday, January 1, 2019 | 43073000 | 546278000 |
| Wednesday, January 1, 2020 | 49761000 | 537632000 |
| Friday, January 1, 2021 | 61345000 | 612337000 |
| Saturday, January 1, 2022 | 56601000 | 696467000 |
| Sunday, January 1, 2023 | 67984000 | 799119000 |
| Monday, January 1, 2024 | 883445000 |
Unlocking the unknown
In the competitive landscape of corporate America, understanding the efficiency of Selling, General, and Administrative (SG&A) expenses is crucial. Waste Connections, Inc. and Saia, Inc. offer a fascinating comparison over the past decade. From 2014 to 2023, Waste Connections, Inc. consistently outpaced Saia, Inc. in SG&A expenditures, with a peak in 2023 reaching nearly $800 million, a staggering 250% increase from 2014. In contrast, Saia, Inc. saw a more modest rise, with SG&A expenses growing by approximately 80% over the same period. This disparity highlights Waste Connections' expansive operational scale compared to Saia's more conservative growth. The data suggests that while both companies have increased their SG&A spending, Waste Connections' growth trajectory is significantly steeper, reflecting its aggressive market strategies. This analysis provides valuable insights for investors and analysts seeking to understand the financial dynamics of these industry players.
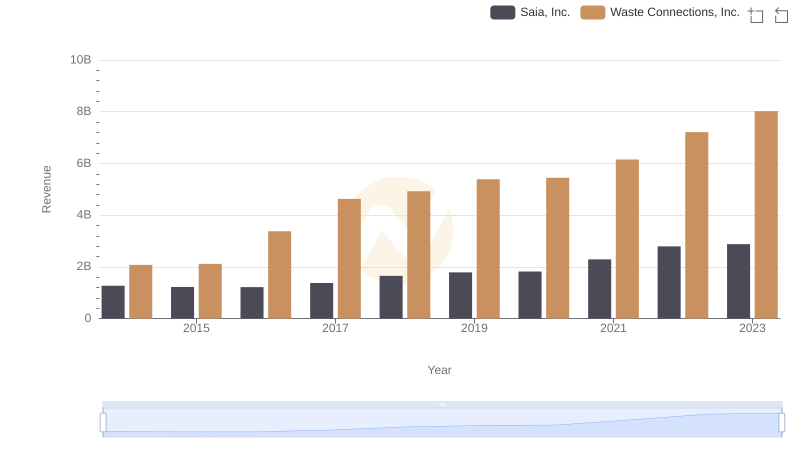
Comparing Revenue Performance: Waste Connections, Inc. or Saia, Inc.?
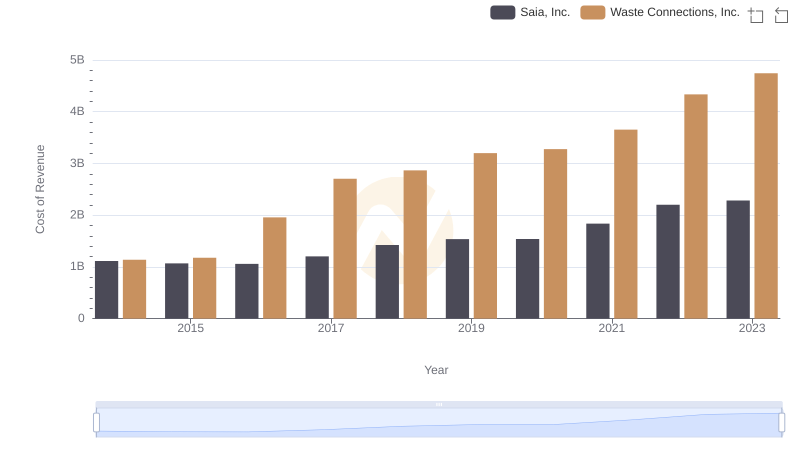
Cost Insights: Breaking Down Waste Connections, Inc. and Saia, Inc.'s Expenses
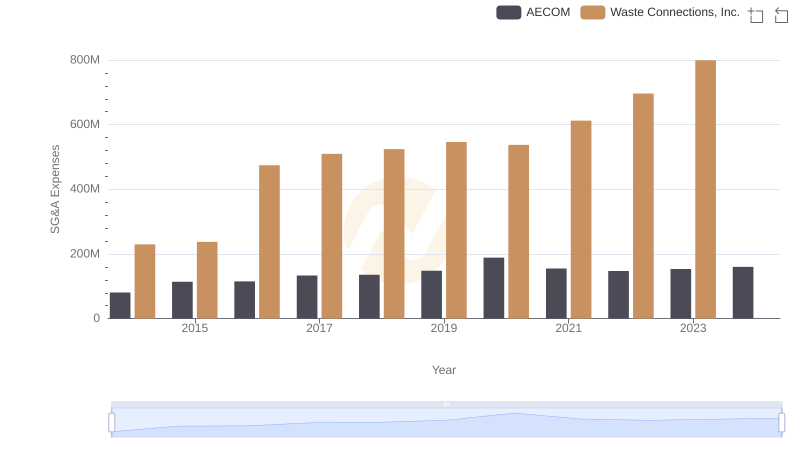
Comparing SG&A Expenses: Waste Connections, Inc. vs AECOM Trends and Insights
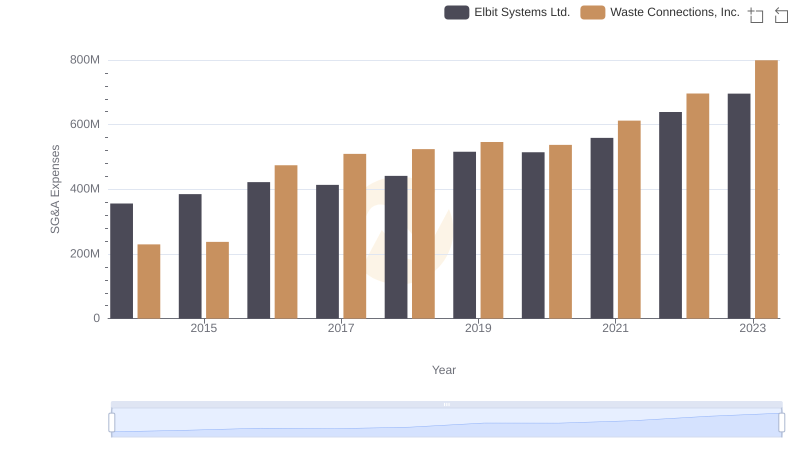
Waste Connections, Inc. and Elbit Systems Ltd.: SG&A Spending Patterns Compared
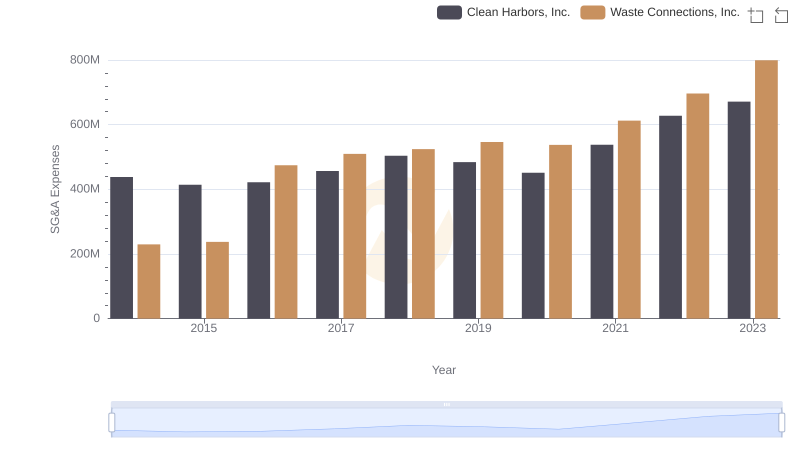
Selling, General, and Administrative Costs: Waste Connections, Inc. vs Clean Harbors, Inc.
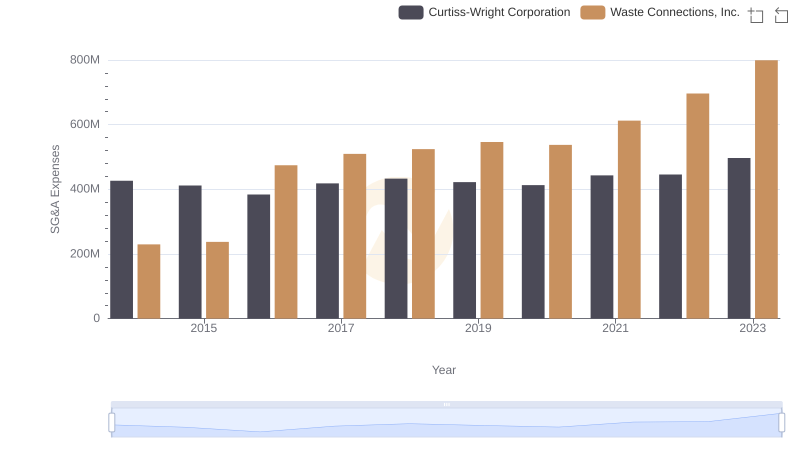
Waste Connections, Inc. vs Curtiss-Wright Corporation: SG&A Expense Trends
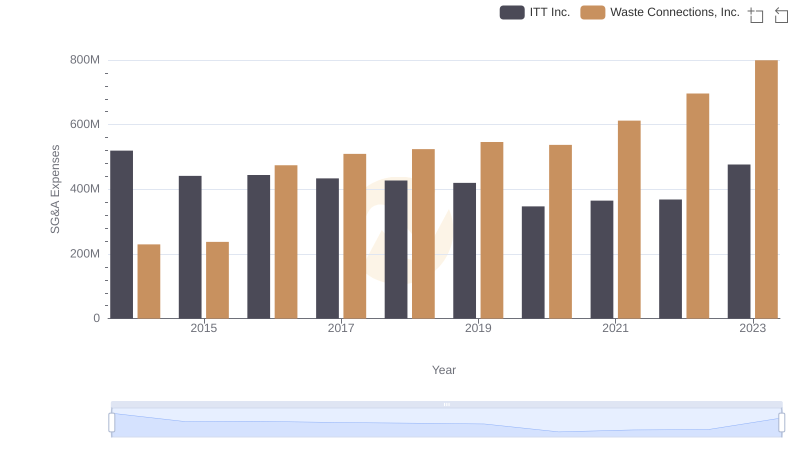
Cost Management Insights: SG&A Expenses for Waste Connections, Inc. and ITT Inc.
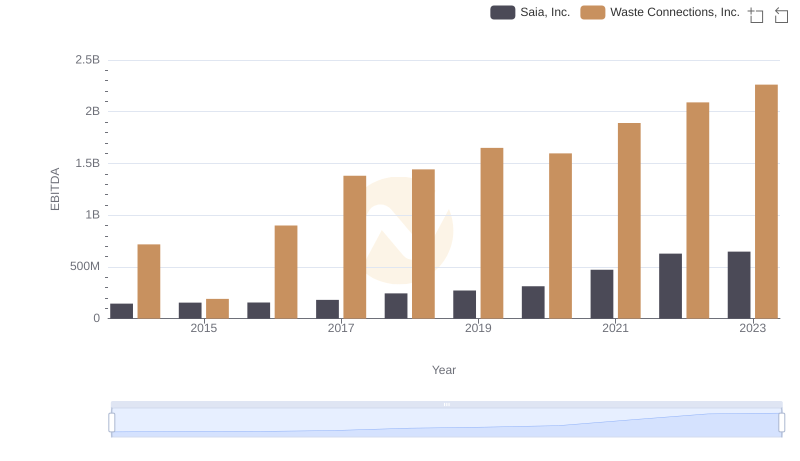
EBITDA Performance Review: Waste Connections, Inc. vs Saia, Inc.