| __timestamp | Global Payments Inc. | Waste Connections, Inc. |
|---|---|---|
| Wednesday, January 1, 2014 | 2773718000 | 2079166000 |
| Thursday, January 1, 2015 | 2898150000 | 2117287000 |
| Friday, January 1, 2016 | 3370976000 | 3375863000 |
| Sunday, January 1, 2017 | 3975163000 | 4630488000 |
| Monday, January 1, 2018 | 3366366000 | 4922941000 |
| Tuesday, January 1, 2019 | 4911892000 | 5388679000 |
| Wednesday, January 1, 2020 | 7423558000 | 5445990000 |
| Friday, January 1, 2021 | 8523762000 | 6151361000 |
| Saturday, January 1, 2022 | 8975515000 | 7211859000 |
| Sunday, January 1, 2023 | 9654419000 | 8021951000 |
| Monday, January 1, 2024 | 10105894000 | 8919591000 |
Unlocking the unknown
In the ever-evolving landscape of corporate growth, Waste Connections, Inc. and Global Payments Inc. have demonstrated remarkable revenue trajectories from 2014 to 2023. Waste Connections, Inc., a leader in waste management, has seen its revenue grow by approximately 286%, starting from $2.08 billion in 2014 to $8.02 billion in 2023. This growth reflects the increasing demand for sustainable waste solutions.
On the other hand, Global Payments Inc., a titan in the financial technology sector, has experienced a staggering 248% increase in revenue, from $2.77 billion in 2014 to $9.65 billion in 2023. This surge underscores the rapid adoption of digital payment solutions worldwide.
Both companies have shown resilience and adaptability, with Waste Connections, Inc. capitalizing on environmental trends and Global Payments Inc. riding the wave of digital transformation. These trends highlight the dynamic nature of their respective industries and the potential for future growth.
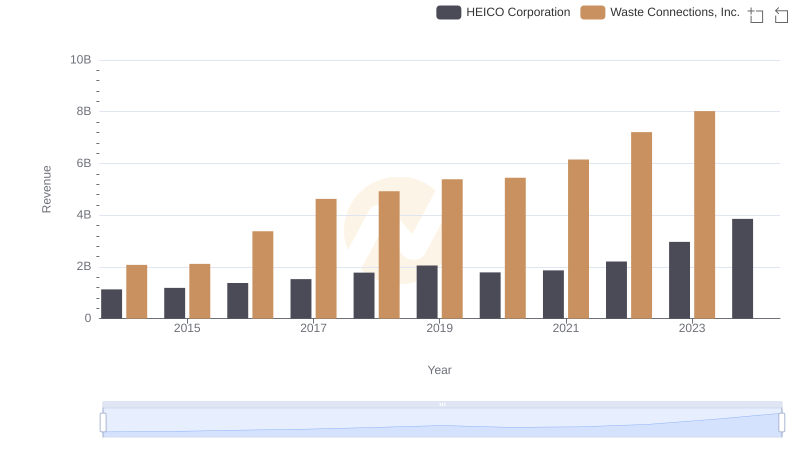
Waste Connections, Inc. vs HEICO Corporation: Examining Key Revenue Metrics
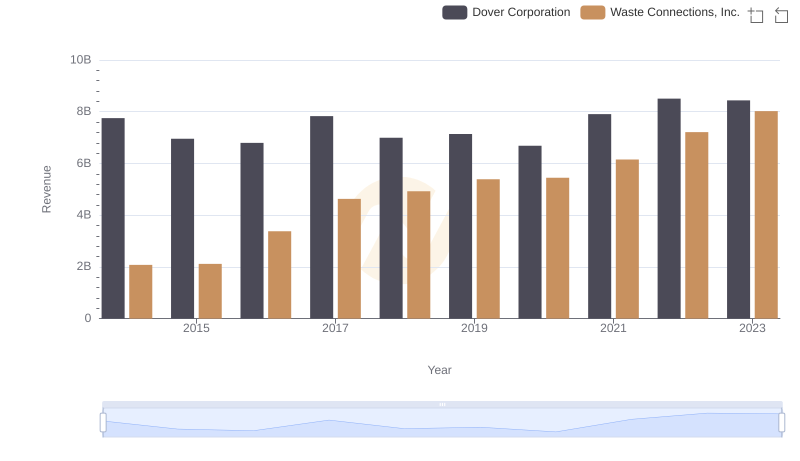
Revenue Showdown: Waste Connections, Inc. vs Dover Corporation
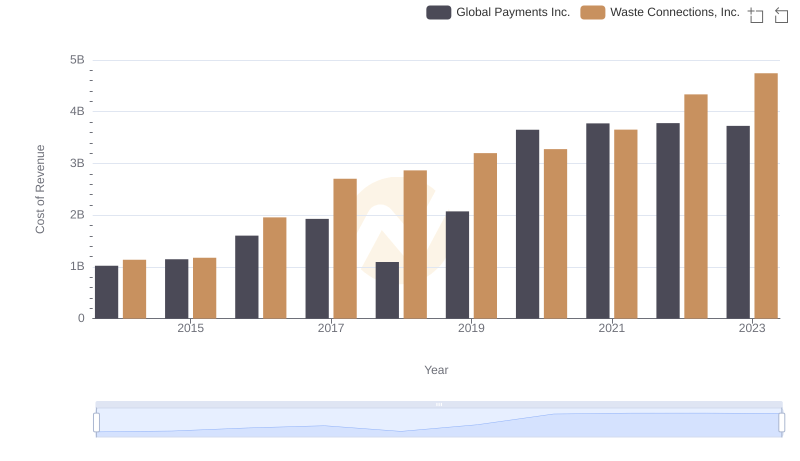
Cost Insights: Breaking Down Waste Connections, Inc. and Global Payments Inc.'s Expenses
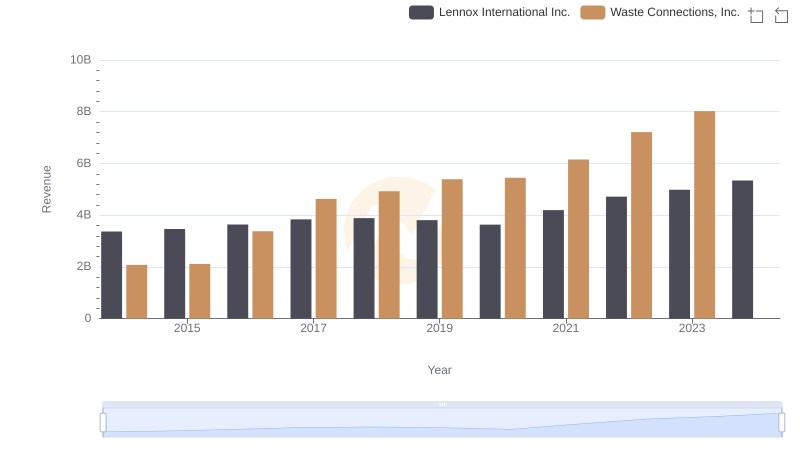
Revenue Insights: Waste Connections, Inc. and Lennox International Inc. Performance Compared
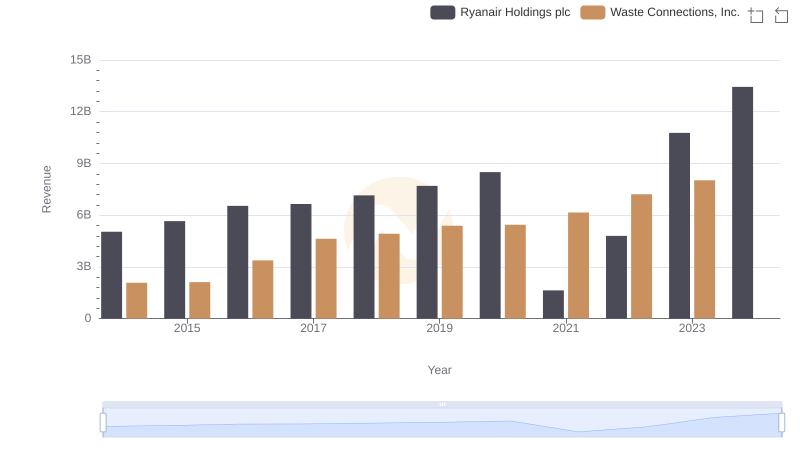
Waste Connections, Inc. vs Ryanair Holdings plc: Examining Key Revenue Metrics
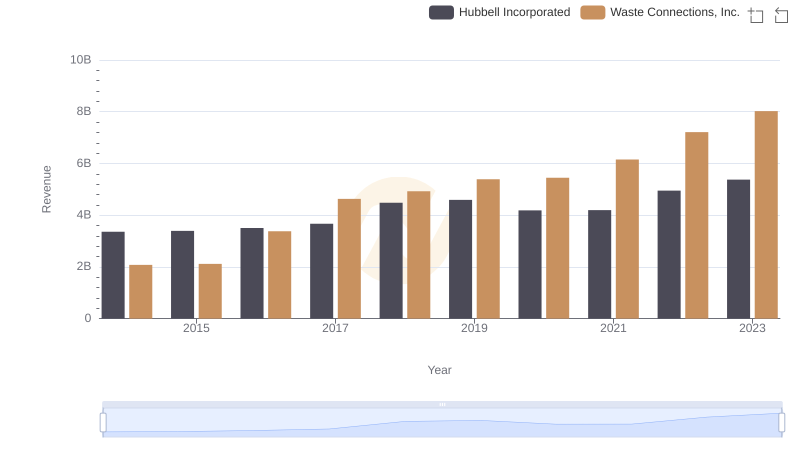
Annual Revenue Comparison: Waste Connections, Inc. vs Hubbell Incorporated
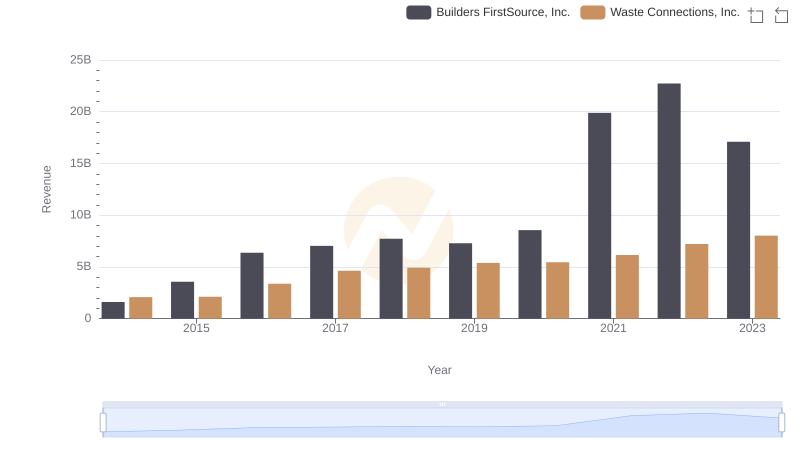
Who Generates More Revenue? Waste Connections, Inc. or Builders FirstSource, Inc.
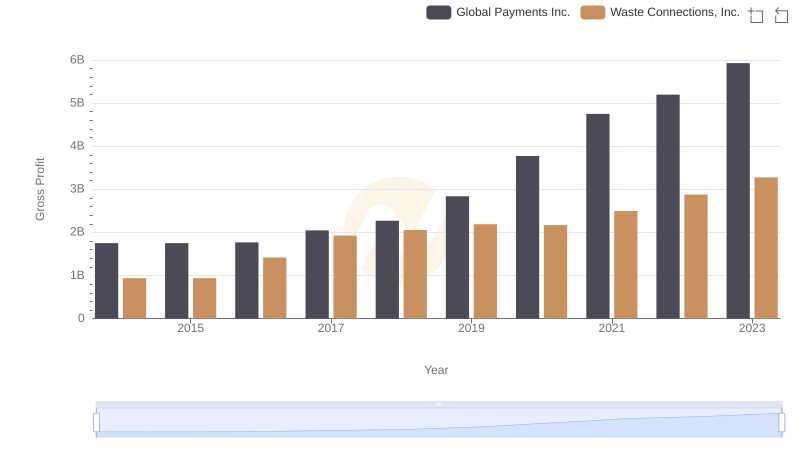
Gross Profit Trends Compared: Waste Connections, Inc. vs Global Payments Inc.
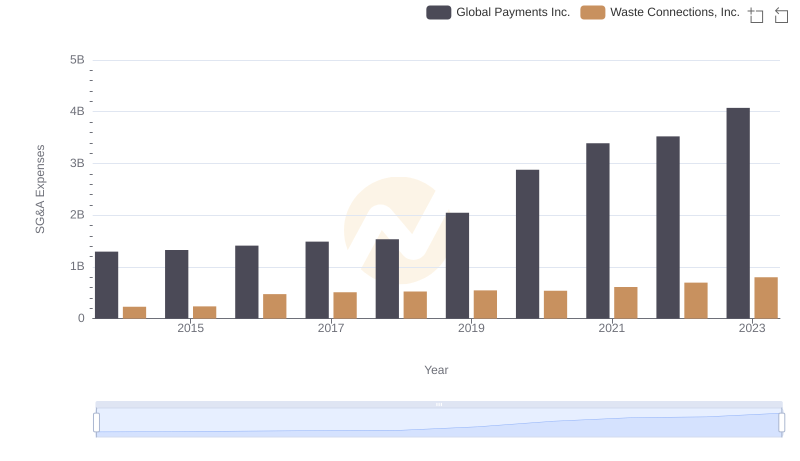
Waste Connections, Inc. and Global Payments Inc.: SG&A Spending Patterns Compared