| __timestamp | Global Payments Inc. | Waste Connections, Inc. |
|---|---|---|
| Wednesday, January 1, 2014 | 1751611000 | 940778000 |
| Thursday, January 1, 2015 | 1750511000 | 939878000 |
| Friday, January 1, 2016 | 1767444000 | 1418151000 |
| Sunday, January 1, 2017 | 2047126000 | 1925713000 |
| Monday, January 1, 2018 | 2271352000 | 2057237000 |
| Tuesday, January 1, 2019 | 2838089000 | 2189922000 |
| Wednesday, January 1, 2020 | 3772831000 | 2169182000 |
| Friday, January 1, 2021 | 4750037000 | 2497287000 |
| Saturday, January 1, 2022 | 5196898000 | 2875847000 |
| Sunday, January 1, 2023 | 5926898000 | 3277438000 |
| Monday, January 1, 2024 | 6345778000 | 3727885000 |
In pursuit of knowledge
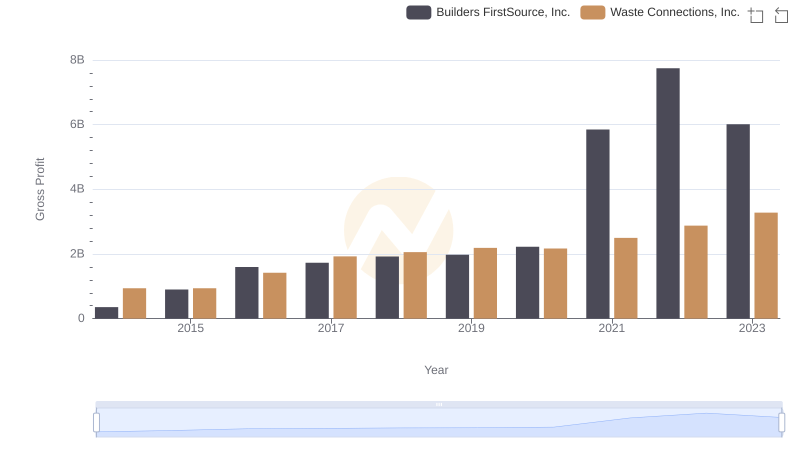
In the ever-evolving landscape of corporate finance, understanding the trajectory of gross profits is crucial. Waste Connections, Inc. and Global Payments Inc. have shown remarkable growth from 2014 to 2023. Global Payments Inc. has seen its gross profit soar by approximately 238%, starting from 2014 and reaching its peak in 2023. Meanwhile, Waste Connections, Inc. has experienced a robust 248% increase over the same period.
The data reveals that both companies have consistently increased their gross profits, with Global Payments Inc. maintaining a higher average. However, Waste Connections, Inc. has shown a more rapid growth rate, closing the gap significantly. This trend highlights the dynamic nature of the industry and the strategic maneuvers by both companies to enhance their financial performance.
The consistent upward trend in gross profits for both companies underscores their resilience and adaptability in a competitive market. As we look to the future, these trends offer valuable insights into the potential trajectories of these industry leaders.
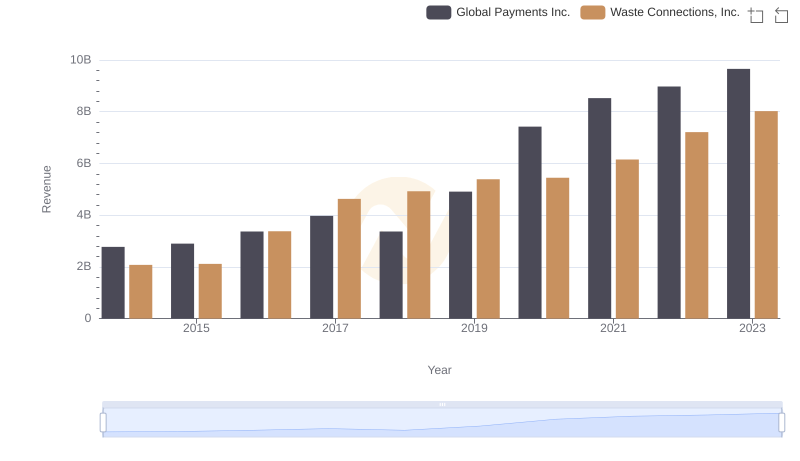
Breaking Down Revenue Trends: Waste Connections, Inc. vs Global Payments Inc.
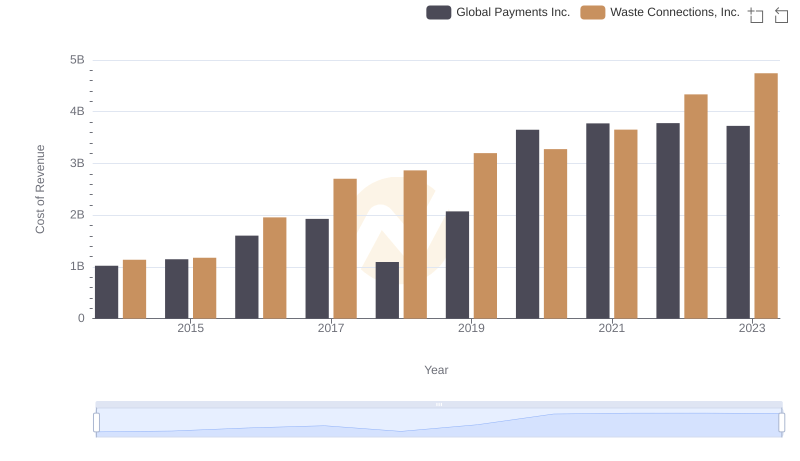
Cost Insights: Breaking Down Waste Connections, Inc. and Global Payments Inc.'s Expenses

Waste Connections, Inc. vs Ferrovial SE: A Gross Profit Performance Breakdown
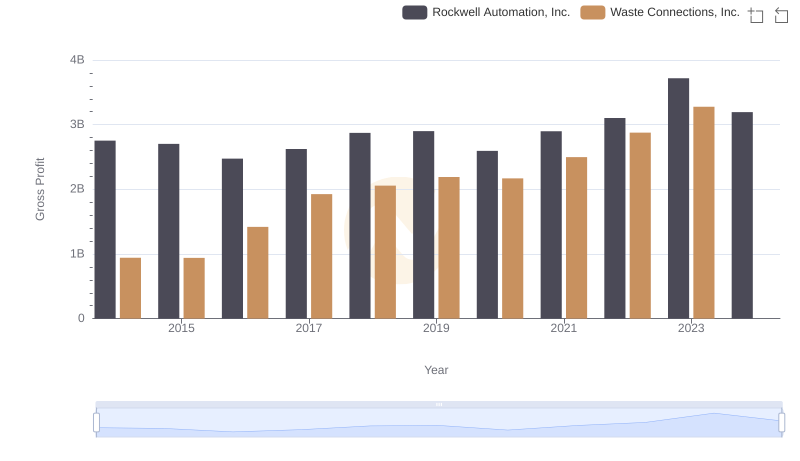
Waste Connections, Inc. and Rockwell Automation, Inc.: A Detailed Gross Profit Analysis
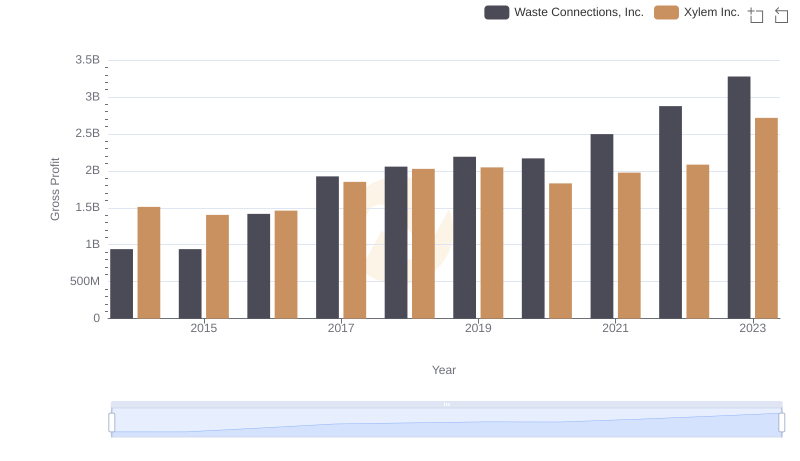
Waste Connections, Inc. vs Xylem Inc.: A Gross Profit Performance Breakdown
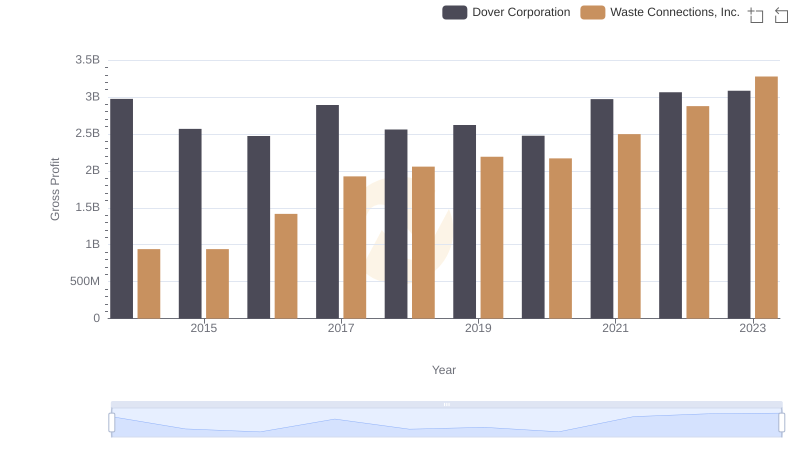
Waste Connections, Inc. and Dover Corporation: A Detailed Gross Profit Analysis
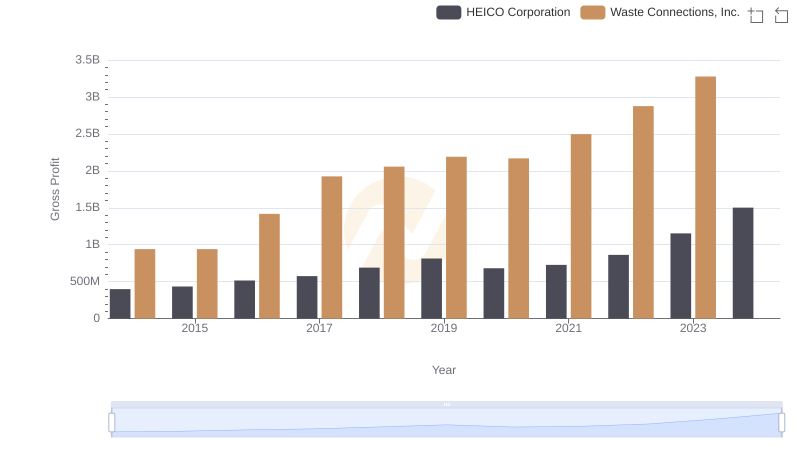
Gross Profit Analysis: Comparing Waste Connections, Inc. and HEICO Corporation
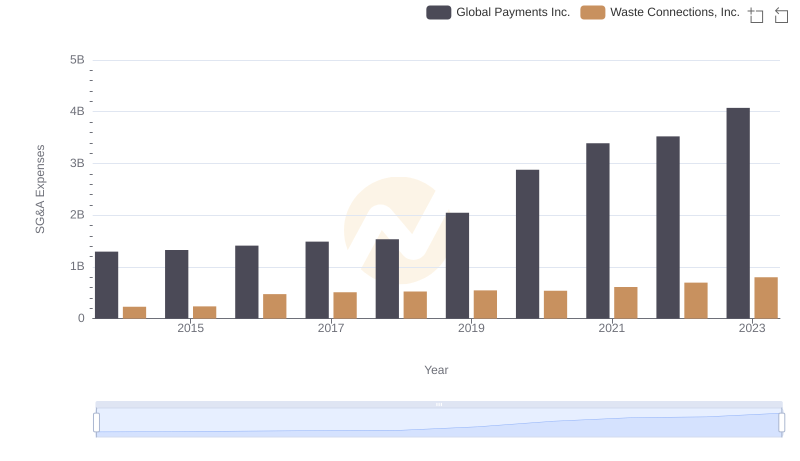
Waste Connections, Inc. and Global Payments Inc.: SG&A Spending Patterns Compared
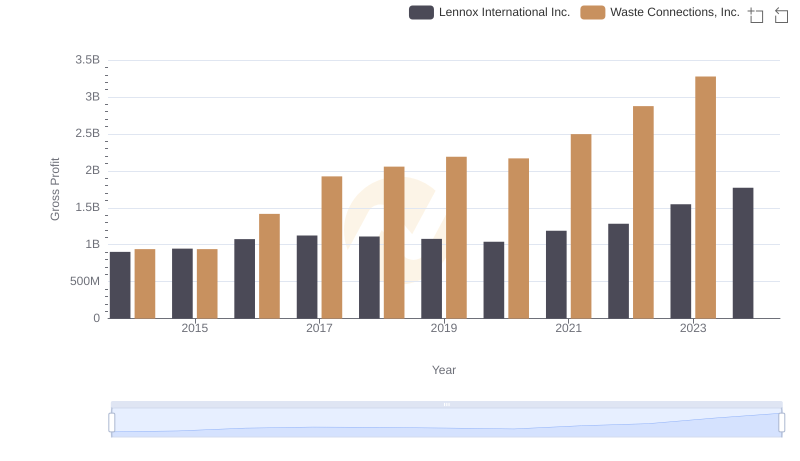
Who Generates Higher Gross Profit? Waste Connections, Inc. or Lennox International Inc.
Key Insights on Gross Profit: Waste Connections, Inc. vs Builders FirstSource, Inc.