| __timestamp | Global Payments Inc. | Waste Connections, Inc. |
|---|---|---|
| Wednesday, January 1, 2014 | 1295014000 | 229474000 |
| Thursday, January 1, 2015 | 1325567000 | 237484000 |
| Friday, January 1, 2016 | 1411096000 | 474263000 |
| Sunday, January 1, 2017 | 1488258000 | 509638000 |
| Monday, January 1, 2018 | 1534297000 | 524388000 |
| Tuesday, January 1, 2019 | 2046672000 | 546278000 |
| Wednesday, January 1, 2020 | 2878878000 | 537632000 |
| Friday, January 1, 2021 | 3391161000 | 612337000 |
| Saturday, January 1, 2022 | 3524578000 | 696467000 |
| Sunday, January 1, 2023 | 4073768000 | 799119000 |
| Monday, January 1, 2024 | 4285307000 | 883445000 |
Igniting the spark of knowledge
In the ever-evolving landscape of corporate finance, understanding the nuances of Selling, General, and Administrative (SG&A) expenses is crucial. Over the past decade, Global Payments Inc. and Waste Connections, Inc. have showcased distinct spending trajectories.
From 2014 to 2023, Global Payments Inc. has seen a remarkable 214% increase in SG&A expenses, reflecting its aggressive growth strategy. This upward trend, peaking at over $4 billion in 2023, underscores the company's commitment to expanding its global footprint and enhancing its technological capabilities.
Conversely, Waste Connections, Inc. has maintained a more conservative approach, with a 248% rise in SG&A expenses over the same period. This steady growth, reaching nearly $800 million in 2023, highlights the company's focus on operational efficiency and sustainable expansion.
These contrasting strategies offer valuable insights into how companies navigate financial management in a competitive market.
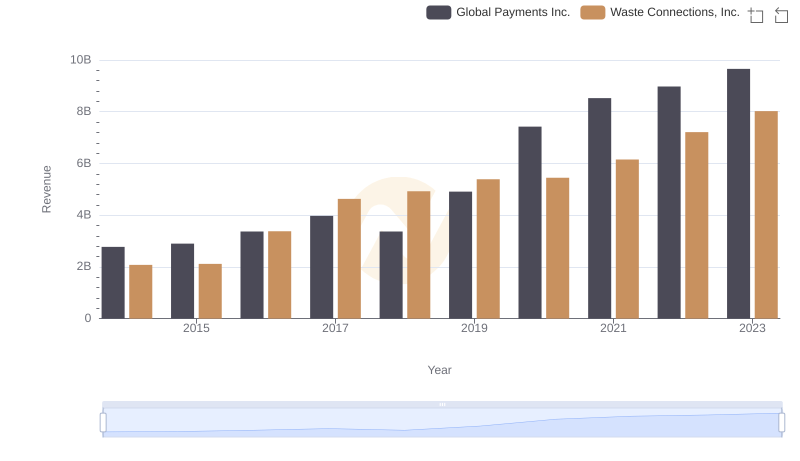
Breaking Down Revenue Trends: Waste Connections, Inc. vs Global Payments Inc.
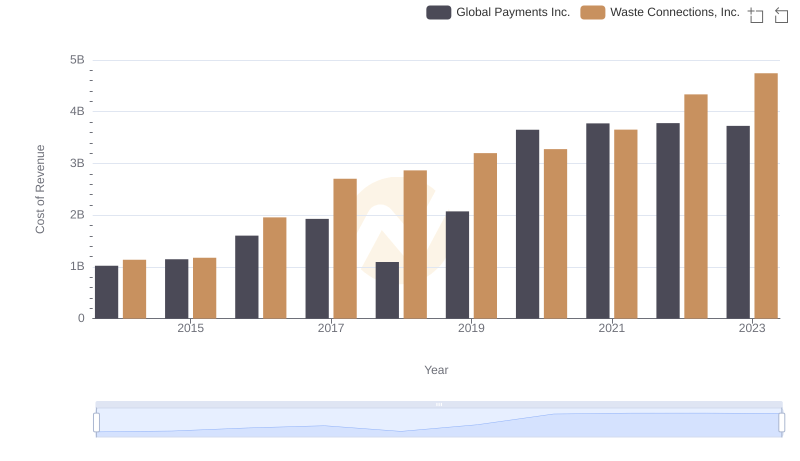
Cost Insights: Breaking Down Waste Connections, Inc. and Global Payments Inc.'s Expenses
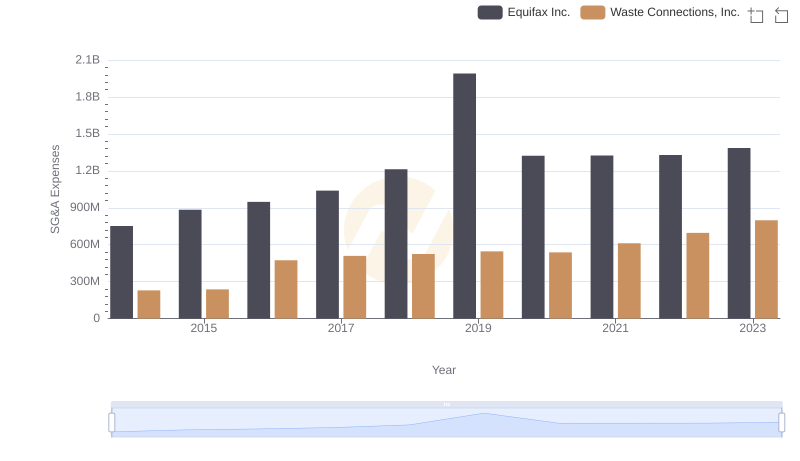
Waste Connections, Inc. and Equifax Inc.: SG&A Spending Patterns Compared
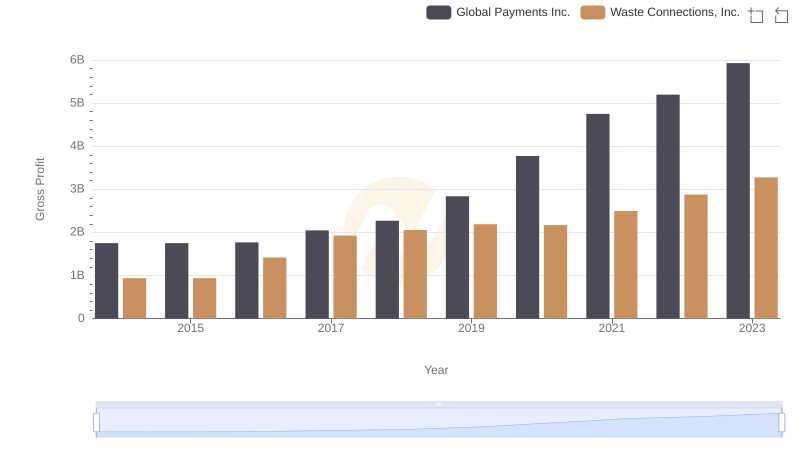
Gross Profit Trends Compared: Waste Connections, Inc. vs Global Payments Inc.

Cost Management Insights: SG&A Expenses for Waste Connections, Inc. and Rockwell Automation, Inc.
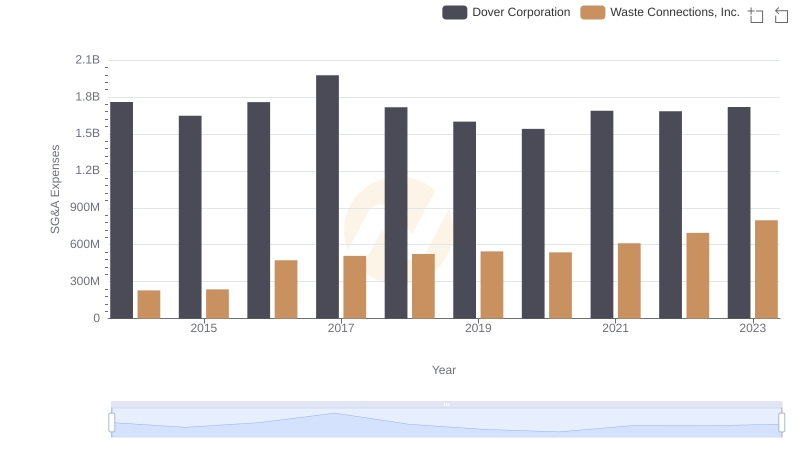
Comparing SG&A Expenses: Waste Connections, Inc. vs Dover Corporation Trends and Insights
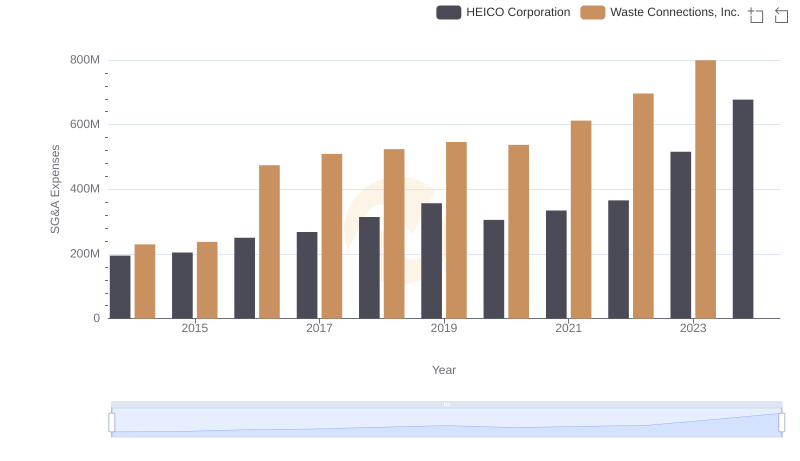
Operational Costs Compared: SG&A Analysis of Waste Connections, Inc. and HEICO Corporation