| __timestamp | TFI International Inc. | United Rentals, Inc. |
|---|---|---|
| Wednesday, January 1, 2014 | 3199928501 | 5685000000 |
| Thursday, January 1, 2015 | 2904026835 | 5817000000 |
| Friday, January 1, 2016 | 2994723606 | 5762000000 |
| Sunday, January 1, 2017 | 3770194035 | 6641000000 |
| Monday, January 1, 2018 | 3761450188 | 8047000000 |
| Tuesday, January 1, 2019 | 3964619871 | 9351000000 |
| Wednesday, January 1, 2020 | 3781134000 | 8530000000 |
| Friday, January 1, 2021 | 7220429000 | 9716000000 |
| Saturday, January 1, 2022 | 8812491000 | 11642000000 |
| Sunday, January 1, 2023 | 7521167000 | 14332000000 |
| Monday, January 1, 2024 | 15345000000 |
Unlocking the unknown
In the competitive landscape of industrial services, United Rentals, Inc. and TFI International Inc. have been key players. Over the past decade, United Rentals has consistently outpaced TFI International in revenue generation. From 2014 to 2023, United Rentals saw a remarkable growth of approximately 152%, reaching a peak revenue of $14.3 billion in 2023. In contrast, TFI International experienced a significant surge in 2021, with revenues jumping by 91% compared to the previous year, but still lagged behind United Rentals.
United Rentals' dominance is evident, especially in recent years, where its revenue in 2023 was nearly double that of TFI International. The data for 2024 is incomplete, but the trend suggests United Rentals' continued leadership. This analysis highlights the dynamic nature of the industry and the strategic maneuvers companies must make to stay ahead.
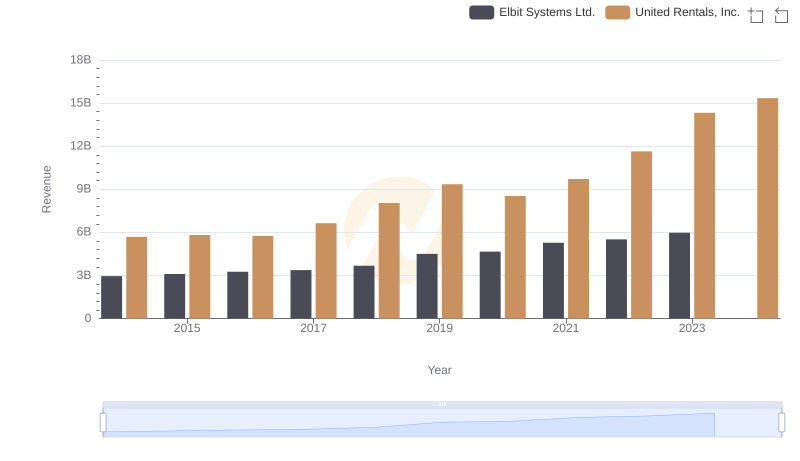
Breaking Down Revenue Trends: United Rentals, Inc. vs Elbit Systems Ltd.
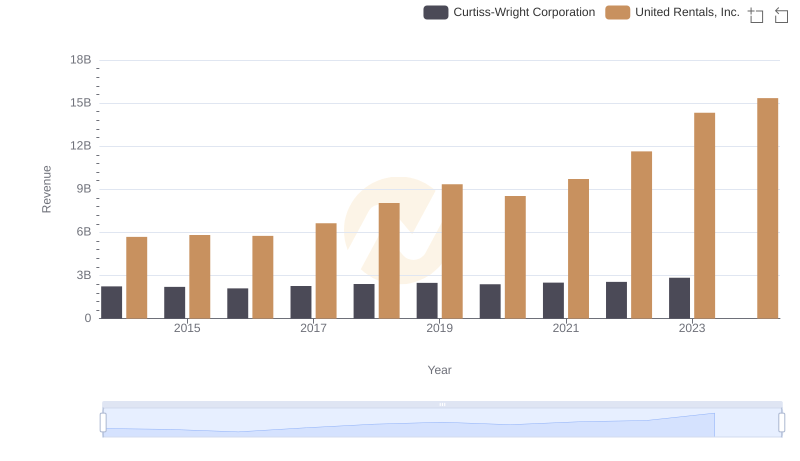
Who Generates More Revenue? United Rentals, Inc. or Curtiss-Wright Corporation
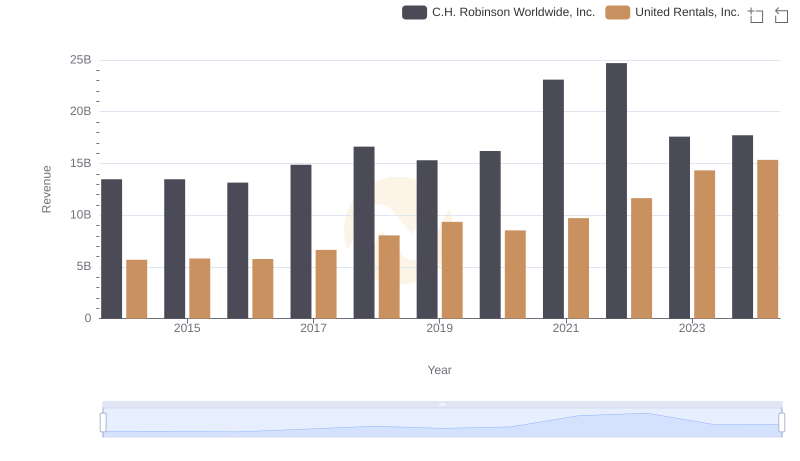
United Rentals, Inc. vs C.H. Robinson Worldwide, Inc.: Examining Key Revenue Metrics
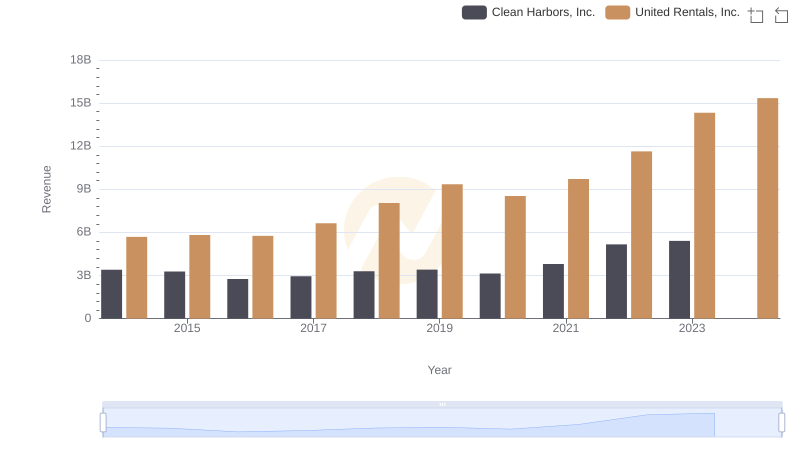
Breaking Down Revenue Trends: United Rentals, Inc. vs Clean Harbors, Inc.
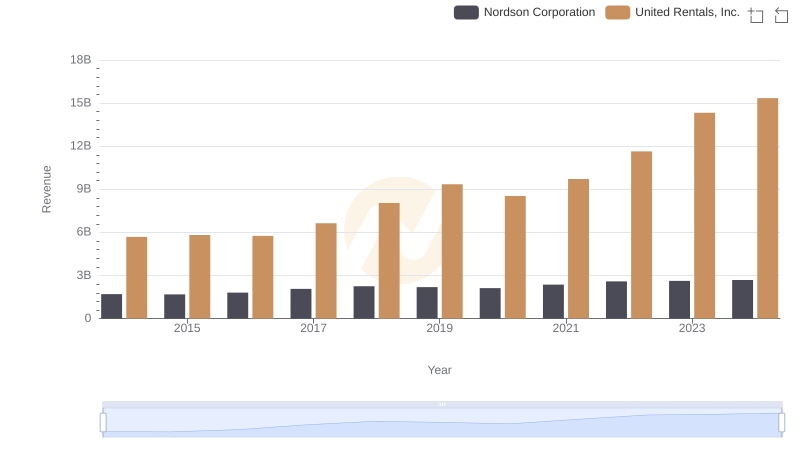
Revenue Showdown: United Rentals, Inc. vs Nordson Corporation
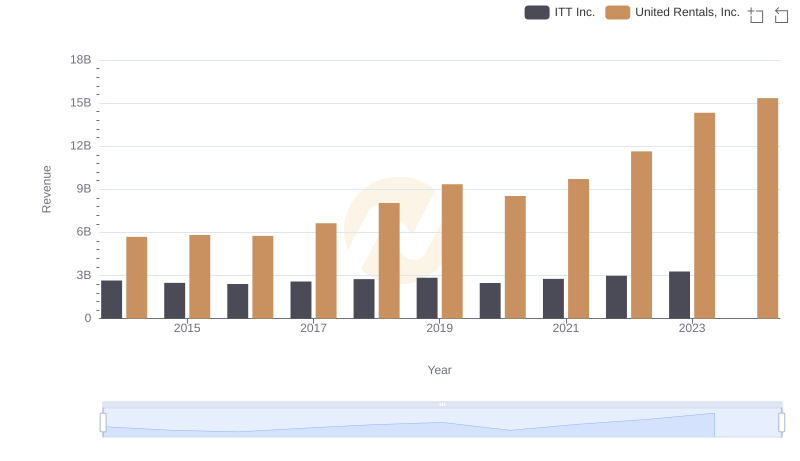
United Rentals, Inc. vs ITT Inc.: Annual Revenue Growth Compared
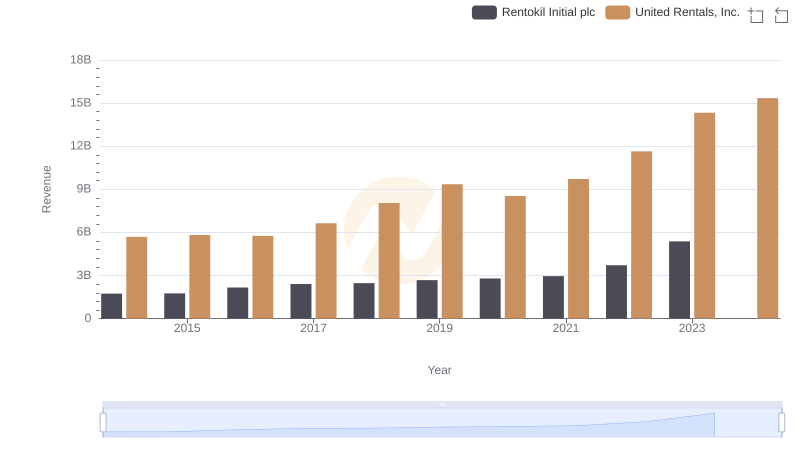
Revenue Showdown: United Rentals, Inc. vs Rentokil Initial plc

United Rentals, Inc. vs Allegion plc: Examining Key Revenue Metrics
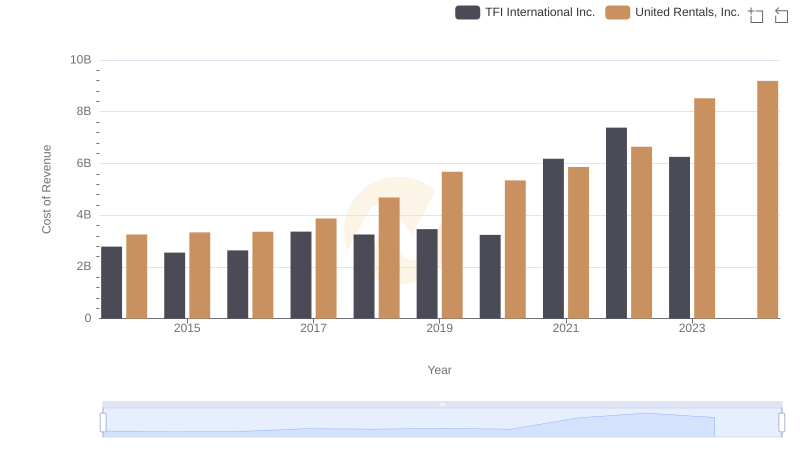
Cost Insights: Breaking Down United Rentals, Inc. and TFI International Inc.'s Expenses
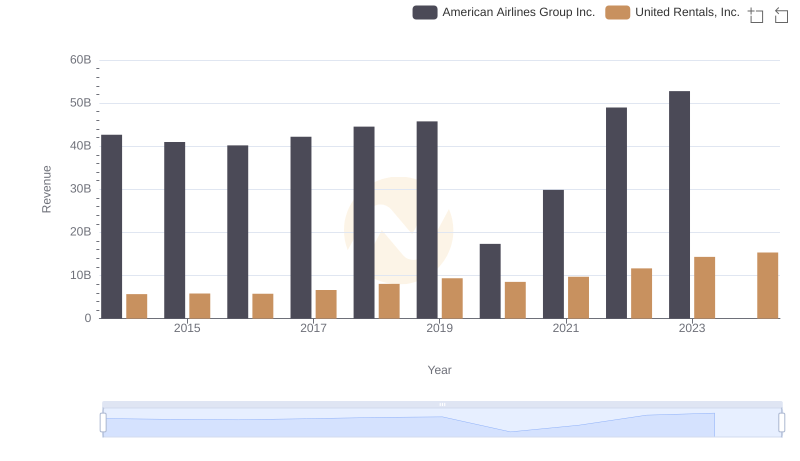
Breaking Down Revenue Trends: United Rentals, Inc. vs American Airlines Group Inc.
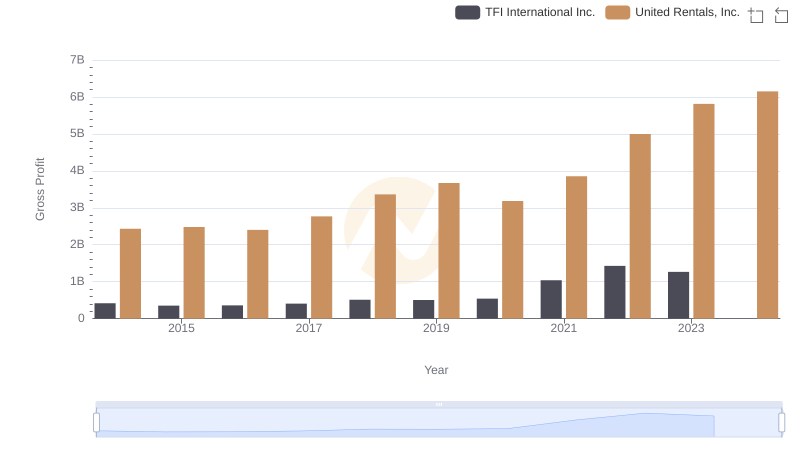
Gross Profit Trends Compared: United Rentals, Inc. vs TFI International Inc.
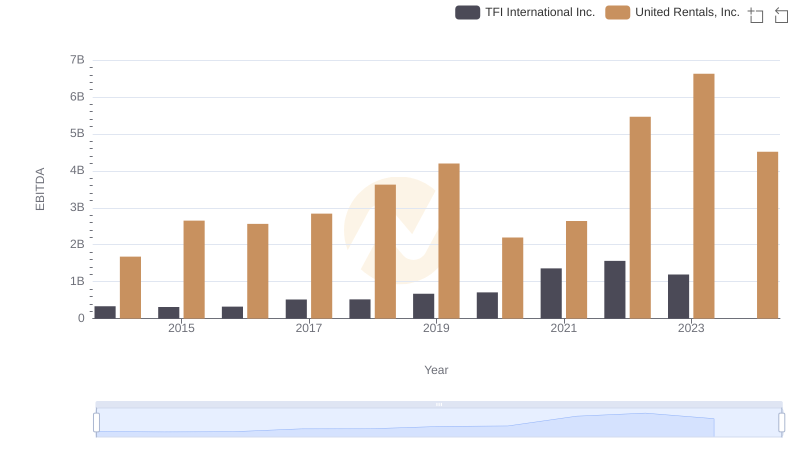
A Professional Review of EBITDA: United Rentals, Inc. Compared to TFI International Inc.