| __timestamp | Graco Inc. | Rockwell Automation, Inc. |
|---|---|---|
| Wednesday, January 1, 2014 | 303565000 | 1570100000 |
| Thursday, January 1, 2015 | 324016000 | 1506400000 |
| Friday, January 1, 2016 | 341734000 | 1467400000 |
| Sunday, January 1, 2017 | 372496000 | 1591500000 |
| Monday, January 1, 2018 | 382988000 | 1599000000 |
| Tuesday, January 1, 2019 | 367743000 | 1538500000 |
| Wednesday, January 1, 2020 | 355796000 | 1479800000 |
| Friday, January 1, 2021 | 422975000 | 1680000000 |
| Saturday, January 1, 2022 | 404731000 | 1766700000 |
| Sunday, January 1, 2023 | 432156000 | 2023700000 |
| Monday, January 1, 2024 | 465133000 | 2002600000 |
Unleashing the power of data
In the world of industrial automation and manufacturing, understanding spending patterns can reveal much about a company's strategic priorities. Rockwell Automation, Inc. and Graco Inc. have shown distinct trends in their Selling, General, and Administrative (SG&A) expenses over the past decade.
From 2014 to 2024, Rockwell Automation's SG&A expenses have consistently been higher, peaking at approximately $2 billion in 2023. This represents a 29% increase from their 2014 levels. In contrast, Graco Inc. has seen a more modest rise, with their SG&A expenses growing by about 53% over the same period, reaching around $465 million in 2024.
These trends suggest Rockwell Automation's aggressive investment in administrative and sales functions, possibly to support its expansive growth strategy. Meanwhile, Graco Inc.'s steady increase indicates a more conservative approach, focusing on sustainable growth. Understanding these patterns can provide valuable insights for investors and industry analysts alike.
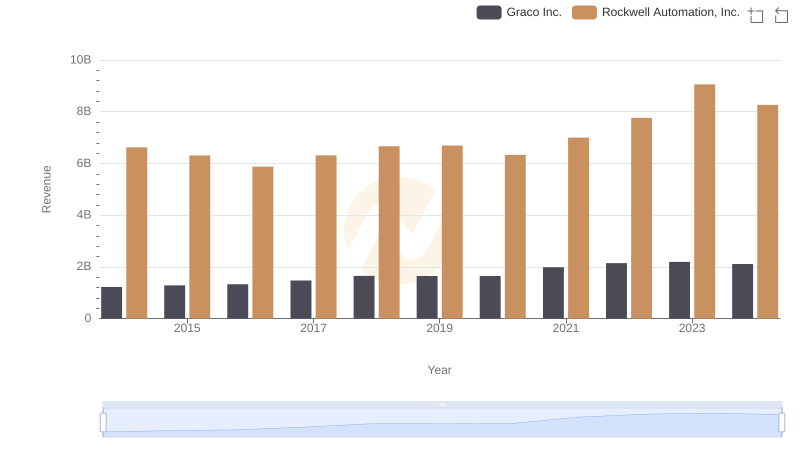
Rockwell Automation, Inc. vs Graco Inc.: Examining Key Revenue Metrics
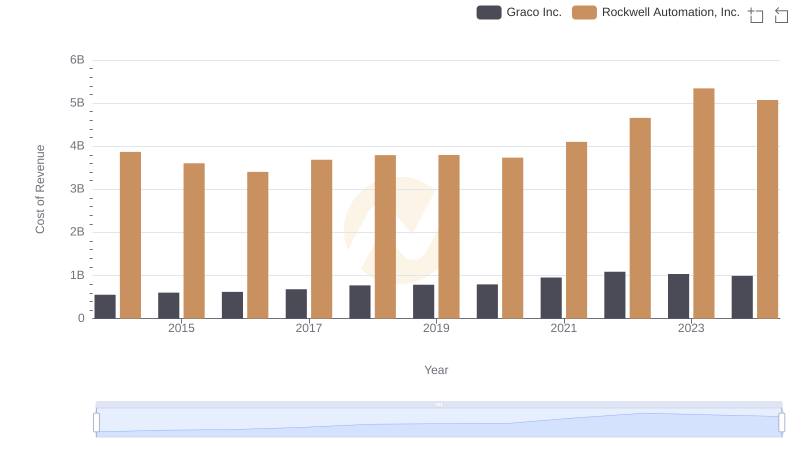
Cost Insights: Breaking Down Rockwell Automation, Inc. and Graco Inc.'s Expenses
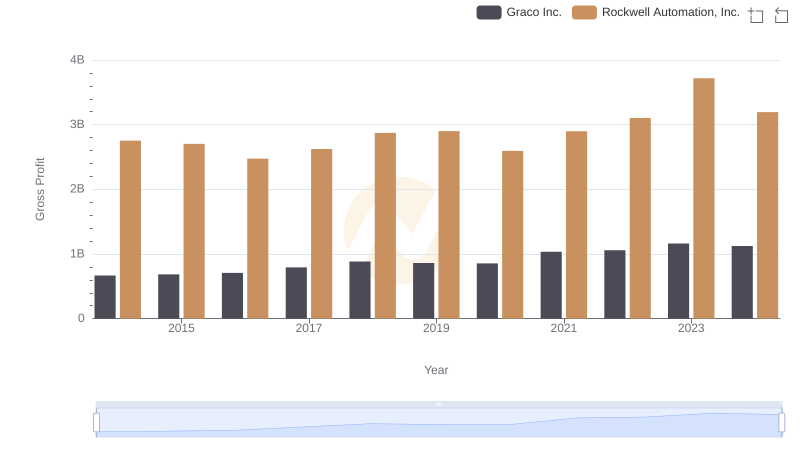
Gross Profit Trends Compared: Rockwell Automation, Inc. vs Graco Inc.
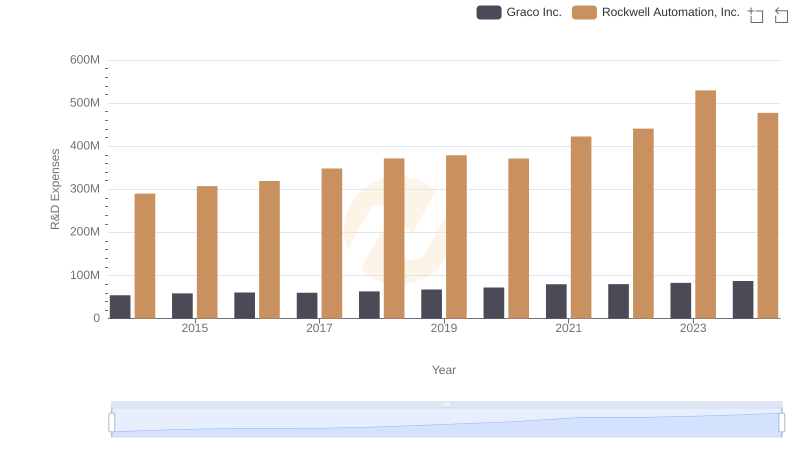
Research and Development Expenses Breakdown: Rockwell Automation, Inc. vs Graco Inc.
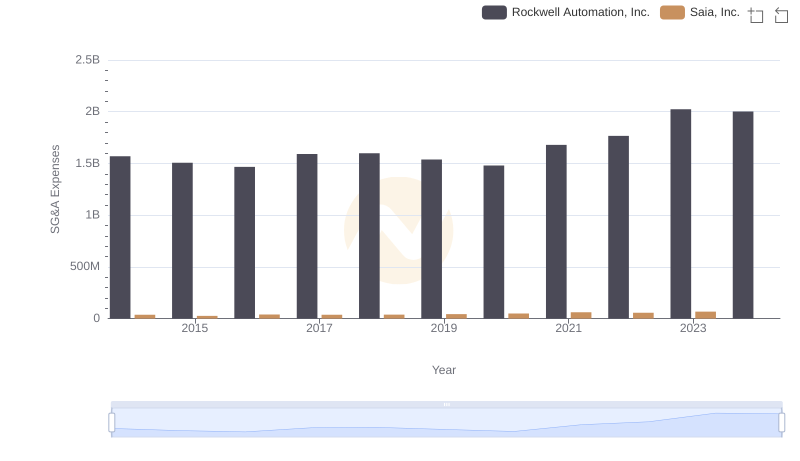
Comparing SG&A Expenses: Rockwell Automation, Inc. vs Saia, Inc. Trends and Insights

Who Optimizes SG&A Costs Better? Rockwell Automation, Inc. or Stanley Black & Decker, Inc.
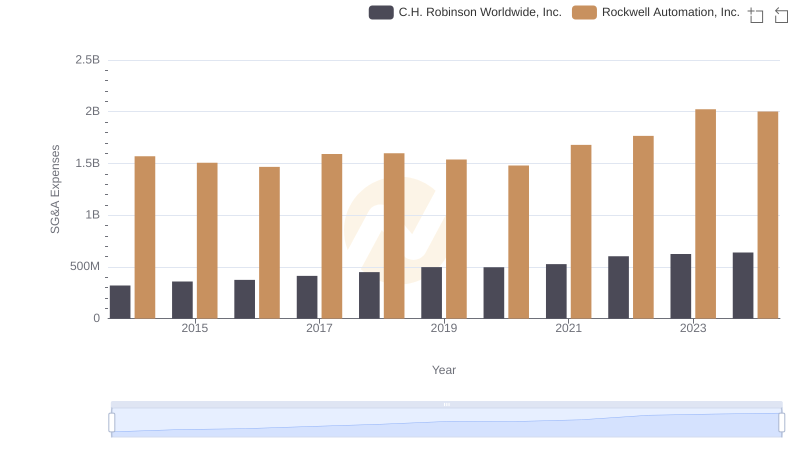
Cost Management Insights: SG&A Expenses for Rockwell Automation, Inc. and C.H. Robinson Worldwide, Inc.
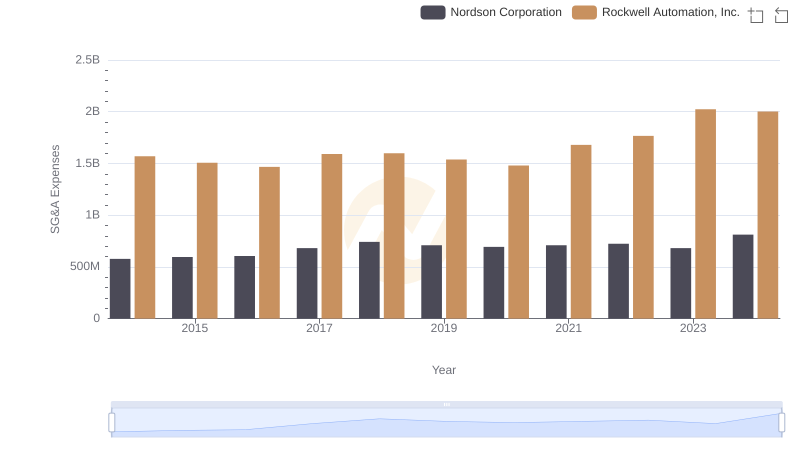
Selling, General, and Administrative Costs: Rockwell Automation, Inc. vs Nordson Corporation
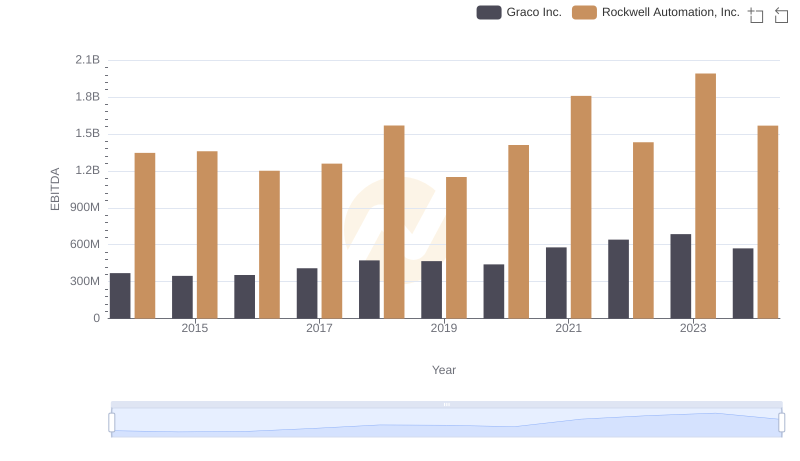
A Side-by-Side Analysis of EBITDA: Rockwell Automation, Inc. and Graco Inc.