| __timestamp | Booz Allen Hamilton Holding Corporation | Parker-Hannifin Corporation |
|---|---|---|
| Wednesday, January 1, 2014 | 2716113000 | 10188227000 |
| Thursday, January 1, 2015 | 2593849000 | 9655245000 |
| Friday, January 1, 2016 | 2580026000 | 8823384000 |
| Sunday, January 1, 2017 | 2691982000 | 9188962000 |
| Monday, January 1, 2018 | 2867103000 | 10762841000 |
| Tuesday, January 1, 2019 | 3100466000 | 10703484000 |
| Wednesday, January 1, 2020 | 3379180000 | 10286518000 |
| Friday, January 1, 2021 | 3657530000 | 10449680000 |
| Saturday, January 1, 2022 | 3899622000 | 11387267000 |
| Sunday, January 1, 2023 | 4304810000 | 12635892000 |
| Monday, January 1, 2024 | 8202847000 | 12801816000 |
Unveiling the hidden dimensions of data
In the ever-evolving landscape of corporate finance, understanding cost structures is pivotal. This analysis delves into the cost of revenue trends for Parker-Hannifin Corporation and Booz Allen Hamilton Holding Corporation from 2014 to 2024. Over this decade, Parker-Hannifin consistently outpaced Booz Allen Hamilton in cost of revenue, with a notable 25% increase from 2014 to 2023, peaking at approximately $12.6 billion. In contrast, Booz Allen Hamilton's cost of revenue surged by nearly 59% during the same period, reaching around $4.3 billion in 2023. The data highlights Parker-Hannifin's robust growth trajectory, culminating in a projected $12.8 billion in 2024. Meanwhile, Booz Allen Hamilton's dramatic leap to $8.2 billion in 2024 suggests strategic shifts. This comparative insight underscores the dynamic nature of corporate expenses and the strategic maneuvers companies employ to navigate financial landscapes.
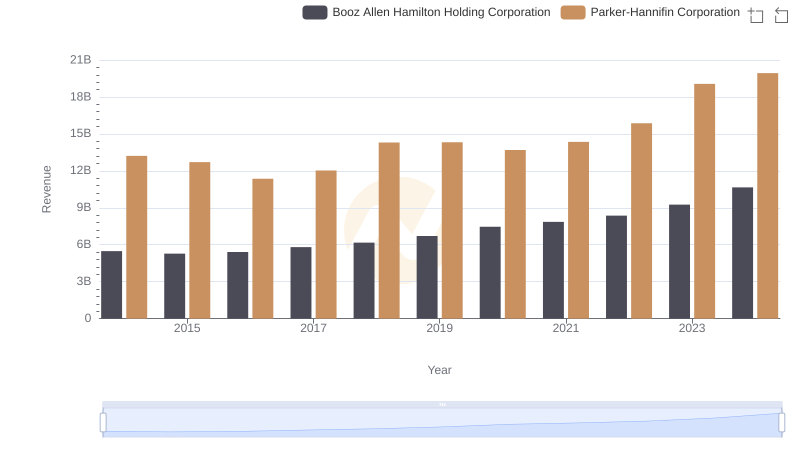
Revenue Showdown: Parker-Hannifin Corporation vs Booz Allen Hamilton Holding Corporation
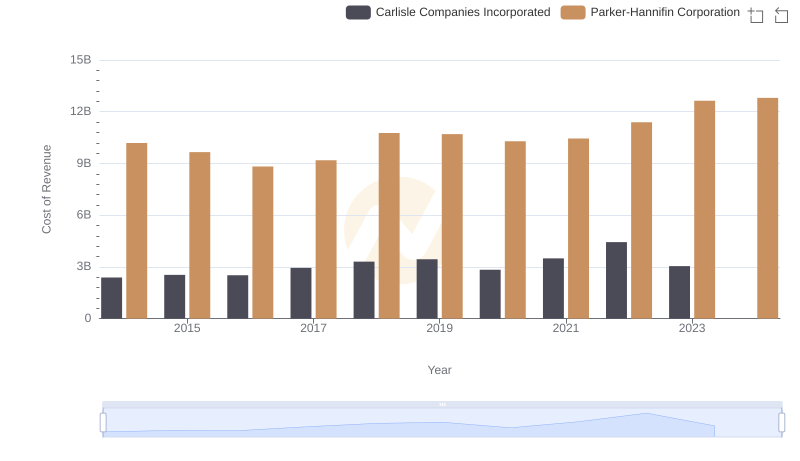
Comparing Cost of Revenue Efficiency: Parker-Hannifin Corporation vs Carlisle Companies Incorporated
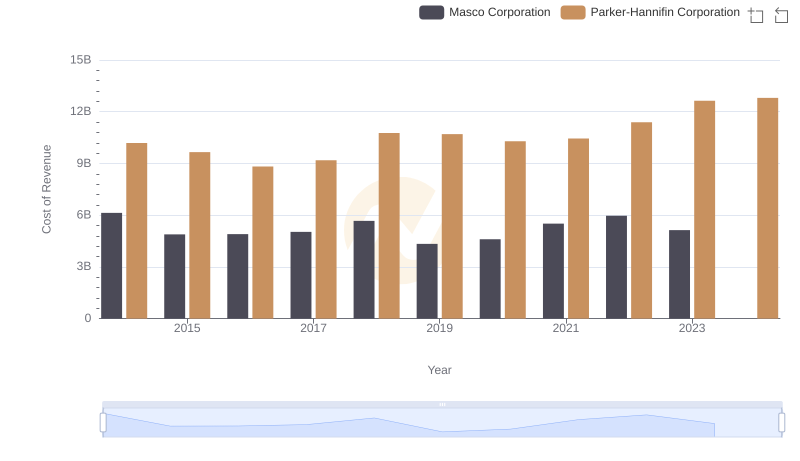
Analyzing Cost of Revenue: Parker-Hannifin Corporation and Masco Corporation
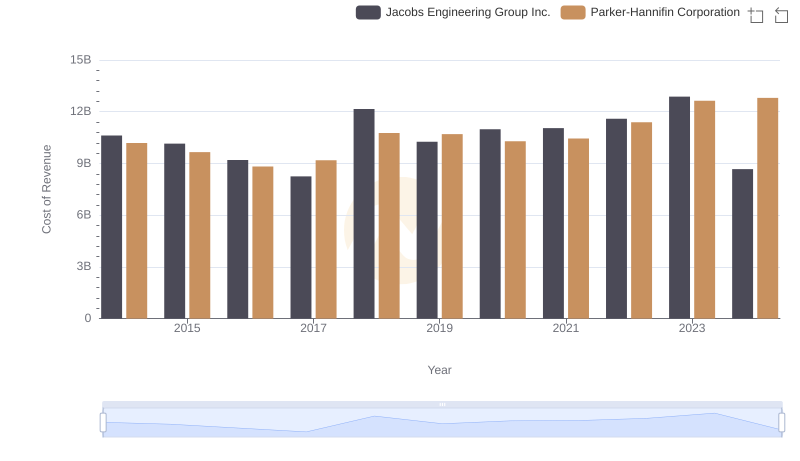
Parker-Hannifin Corporation vs Jacobs Engineering Group Inc.: Efficiency in Cost of Revenue Explored
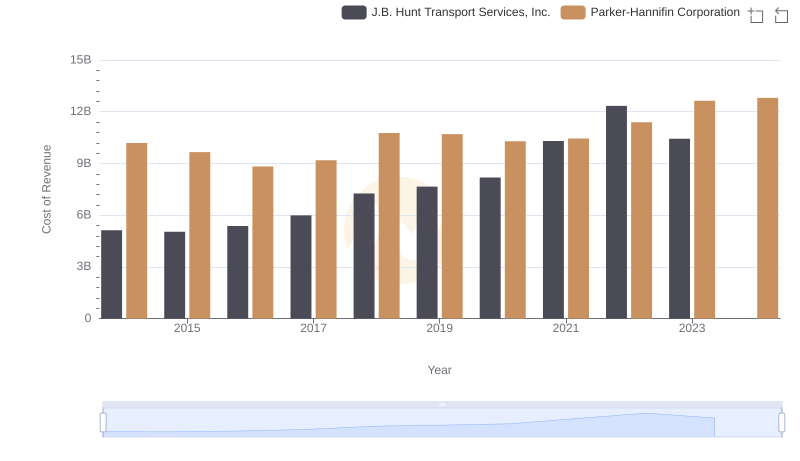
Parker-Hannifin Corporation vs J.B. Hunt Transport Services, Inc.: Efficiency in Cost of Revenue Explored
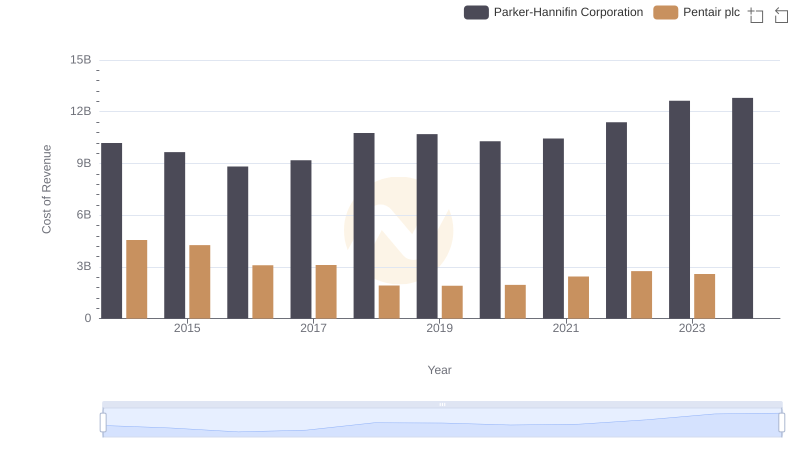
Cost Insights: Breaking Down Parker-Hannifin Corporation and Pentair plc's Expenses
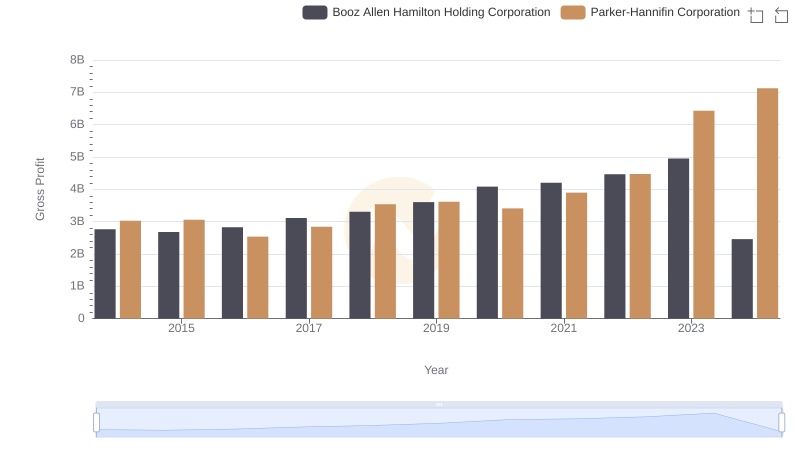
Key Insights on Gross Profit: Parker-Hannifin Corporation vs Booz Allen Hamilton Holding Corporation
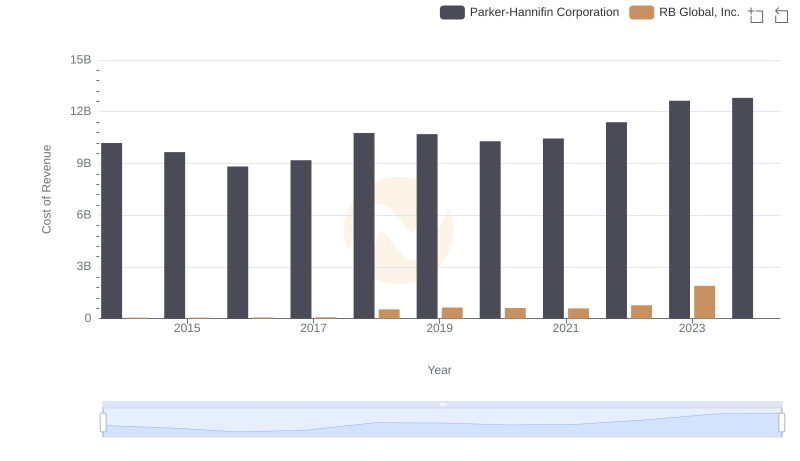
Cost Insights: Breaking Down Parker-Hannifin Corporation and RB Global, Inc.'s Expenses
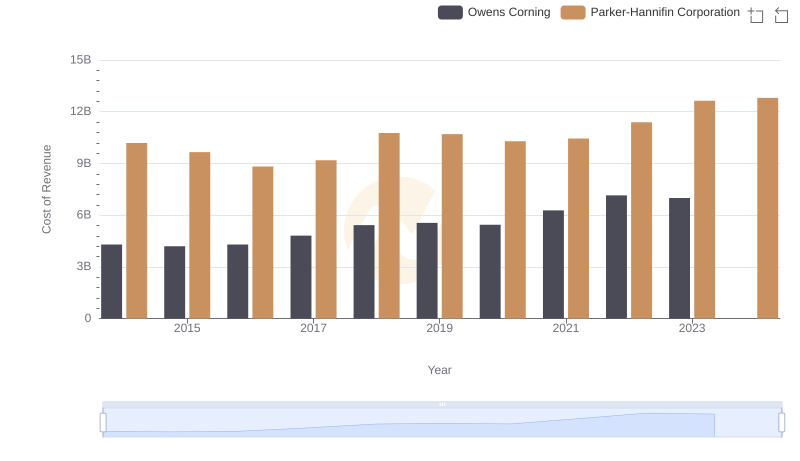
Parker-Hannifin Corporation vs Owens Corning: Efficiency in Cost of Revenue Explored
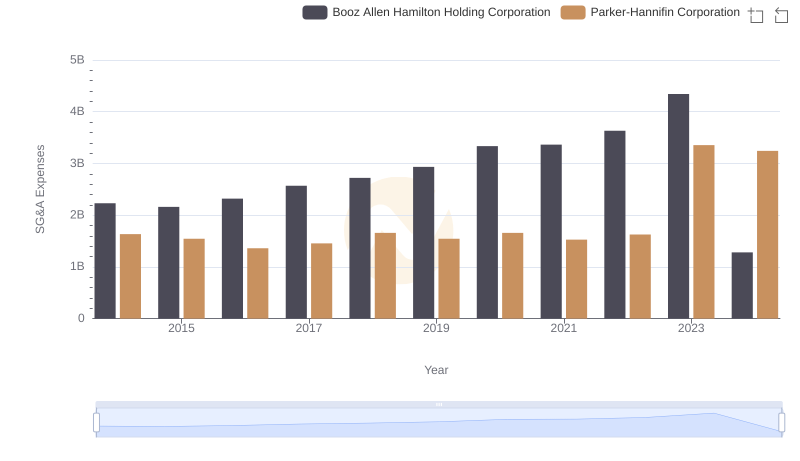
Breaking Down SG&A Expenses: Parker-Hannifin Corporation vs Booz Allen Hamilton Holding Corporation