| __timestamp | Masco Corporation | Parker-Hannifin Corporation |
|---|---|---|
| Wednesday, January 1, 2014 | 6134000000 | 10188227000 |
| Thursday, January 1, 2015 | 4889000000 | 9655245000 |
| Friday, January 1, 2016 | 4901000000 | 8823384000 |
| Sunday, January 1, 2017 | 5033000000 | 9188962000 |
| Monday, January 1, 2018 | 5670000000 | 10762841000 |
| Tuesday, January 1, 2019 | 4336000000 | 10703484000 |
| Wednesday, January 1, 2020 | 4601000000 | 10286518000 |
| Friday, January 1, 2021 | 5512000000 | 10449680000 |
| Saturday, January 1, 2022 | 5967000000 | 11387267000 |
| Sunday, January 1, 2023 | 5131000000 | 12635892000 |
| Monday, January 1, 2024 | 4997000000 | 12801816000 |
Unleashing the power of data
In the ever-evolving landscape of industrial manufacturing, Parker-Hannifin Corporation and Masco Corporation stand as titans. Over the past decade, Parker-Hannifin has consistently outpaced Masco in terms of cost of revenue, with figures peaking at approximately $12.8 billion in 2024. This represents a remarkable 45% increase from 2014. Meanwhile, Masco's cost of revenue has shown more volatility, with a notable dip in 2019 to around $4.3 billion, before recovering to $5.1 billion in 2023.
From 2014 to 2023, Parker-Hannifin's cost of revenue grew by an average of 2.6% annually, reflecting its robust market position. In contrast, Masco's figures reveal a more modest growth, averaging 1.1% per year. The data for 2024 is incomplete for Masco, highlighting the need for cautious optimism in forecasting future trends. This analysis underscores the dynamic nature of the industrial sector and the strategic maneuvers of these corporate giants.

Cost of Revenue Trends: Parker-Hannifin Corporation vs Stanley Black & Decker, Inc.
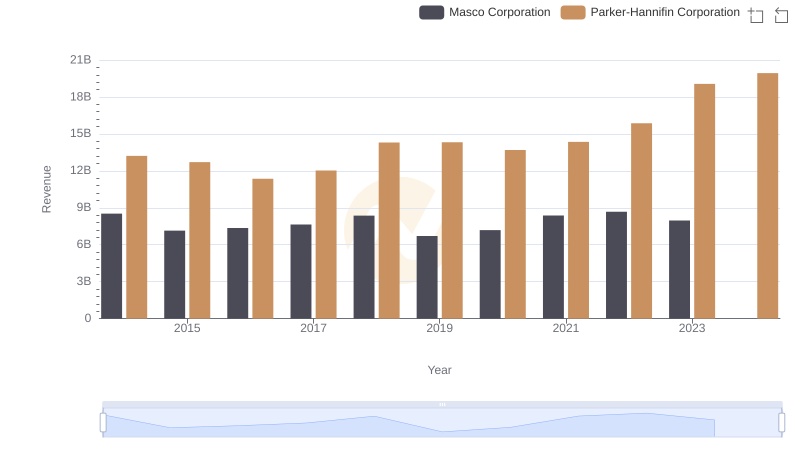
Parker-Hannifin Corporation and Masco Corporation: A Comprehensive Revenue Analysis
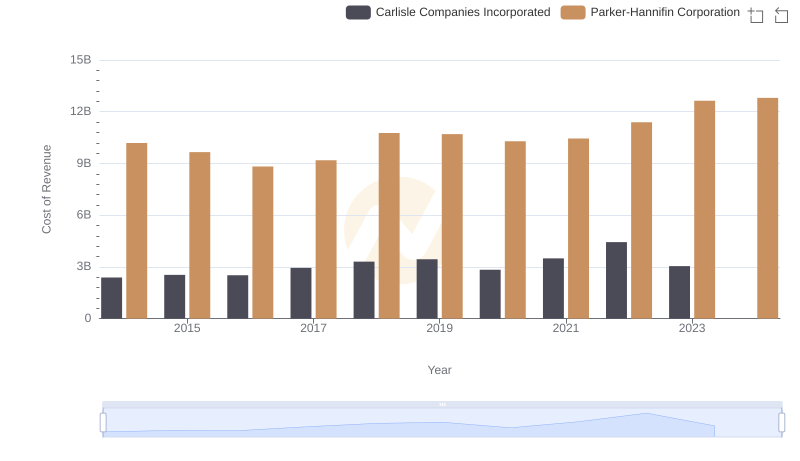
Comparing Cost of Revenue Efficiency: Parker-Hannifin Corporation vs Carlisle Companies Incorporated
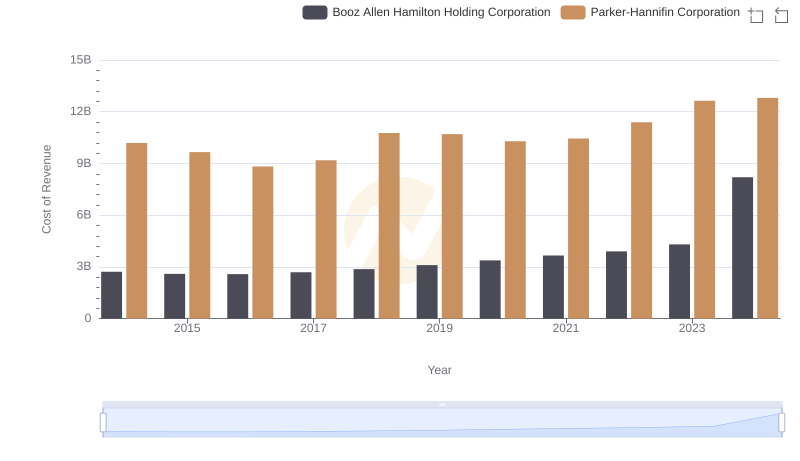
Cost Insights: Breaking Down Parker-Hannifin Corporation and Booz Allen Hamilton Holding Corporation's Expenses
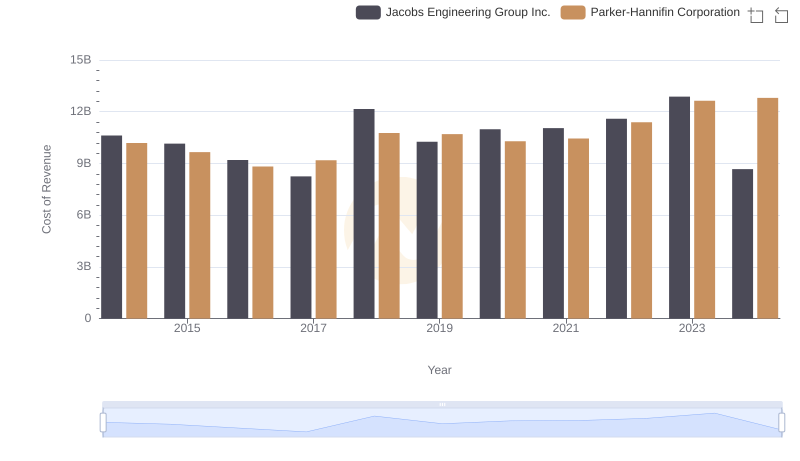
Parker-Hannifin Corporation vs Jacobs Engineering Group Inc.: Efficiency in Cost of Revenue Explored
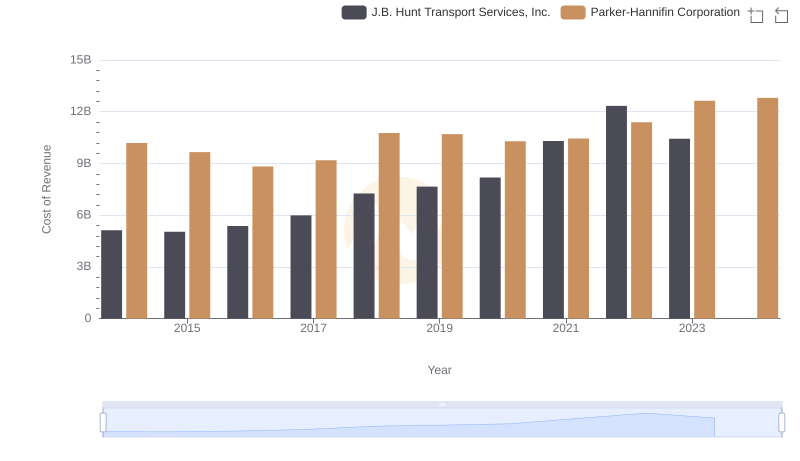
Parker-Hannifin Corporation vs J.B. Hunt Transport Services, Inc.: Efficiency in Cost of Revenue Explored
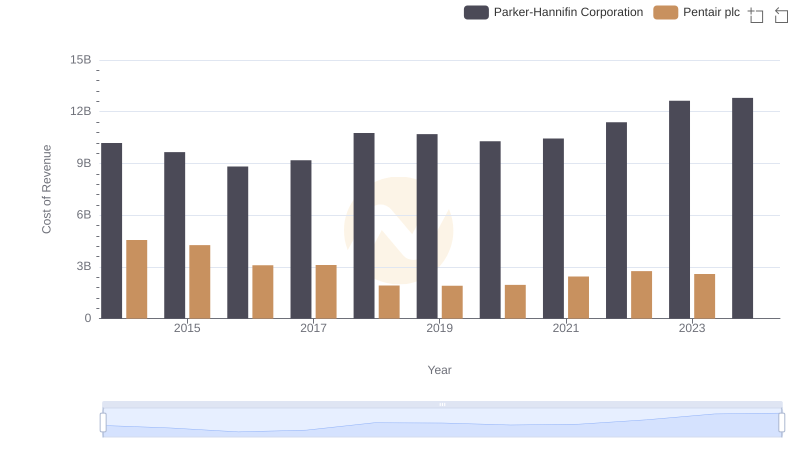
Cost Insights: Breaking Down Parker-Hannifin Corporation and Pentair plc's Expenses
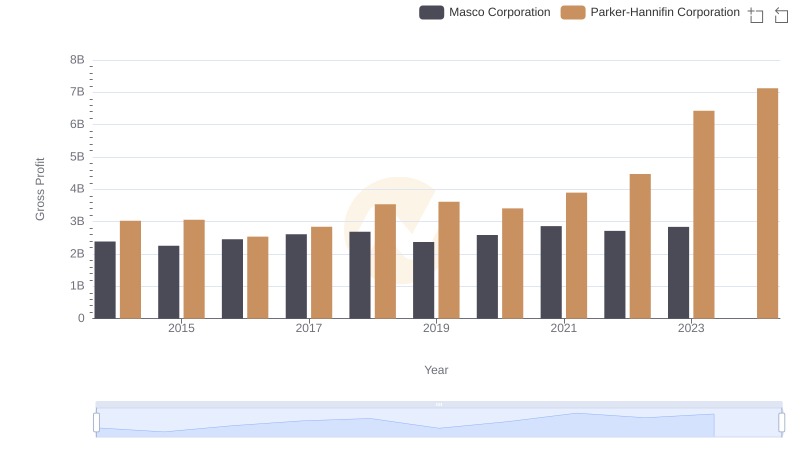
Who Generates Higher Gross Profit? Parker-Hannifin Corporation or Masco Corporation
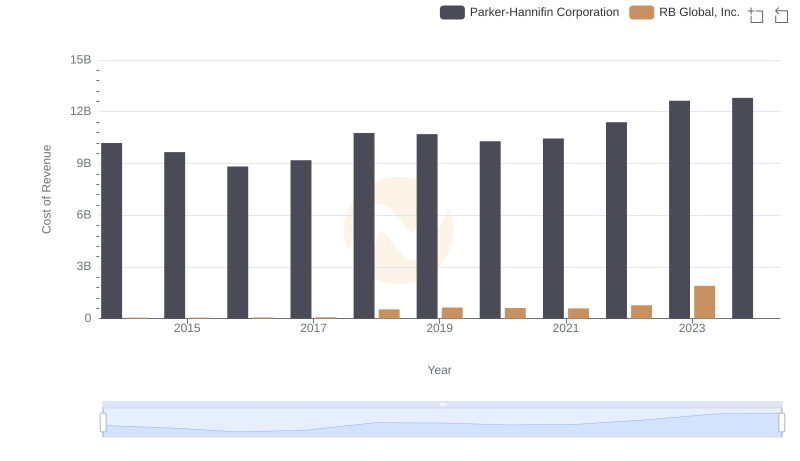
Cost Insights: Breaking Down Parker-Hannifin Corporation and RB Global, Inc.'s Expenses
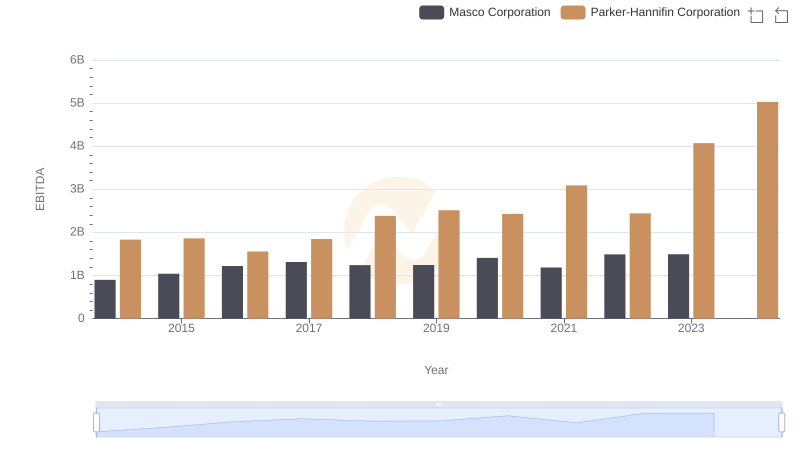
Professional EBITDA Benchmarking: Parker-Hannifin Corporation vs Masco Corporation