| __timestamp | Carlisle Companies Incorporated | Parker-Hannifin Corporation |
|---|---|---|
| Wednesday, January 1, 2014 | 2384500000 | 10188227000 |
| Thursday, January 1, 2015 | 2536500000 | 9655245000 |
| Friday, January 1, 2016 | 2518100000 | 8823384000 |
| Sunday, January 1, 2017 | 2941900000 | 9188962000 |
| Monday, January 1, 2018 | 3304800000 | 10762841000 |
| Tuesday, January 1, 2019 | 3439900000 | 10703484000 |
| Wednesday, January 1, 2020 | 2832500000 | 10286518000 |
| Friday, January 1, 2021 | 3495600000 | 10449680000 |
| Saturday, January 1, 2022 | 4434500000 | 11387267000 |
| Sunday, January 1, 2023 | 3042900000 | 12635892000 |
| Monday, January 1, 2024 | 3115900000 | 12801816000 |
Unveiling the hidden dimensions of data
In the competitive landscape of industrial manufacturing, cost efficiency is a critical metric. Parker-Hannifin Corporation and Carlisle Companies Incorporated, two titans in the industry, have shown distinct trends in their cost of revenue from 2014 to 2023. Parker-Hannifin, with a consistent upward trajectory, saw its cost of revenue rise by approximately 25% over the decade, peaking at $12.8 billion in 2024. In contrast, Carlisle Companies experienced more volatility, with a notable 86% increase from 2014 to 2022, before a dip in 2023. This divergence highlights Parker-Hannifin's steady growth strategy, while Carlisle's fluctuations suggest a more dynamic approach to market challenges. As we look to the future, understanding these trends offers valuable insights into the operational efficiencies and strategic priorities of these industry leaders.
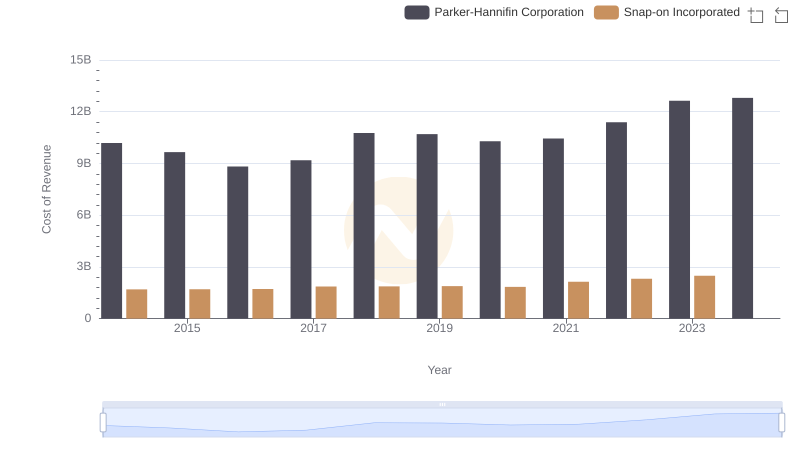
Analyzing Cost of Revenue: Parker-Hannifin Corporation and Snap-on Incorporated

Cost of Revenue Trends: Parker-Hannifin Corporation vs Stanley Black & Decker, Inc.
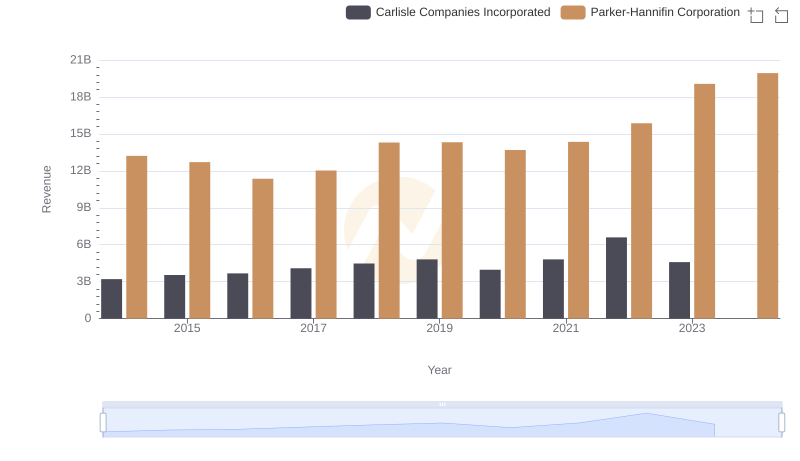
Parker-Hannifin Corporation vs Carlisle Companies Incorporated: Examining Key Revenue Metrics
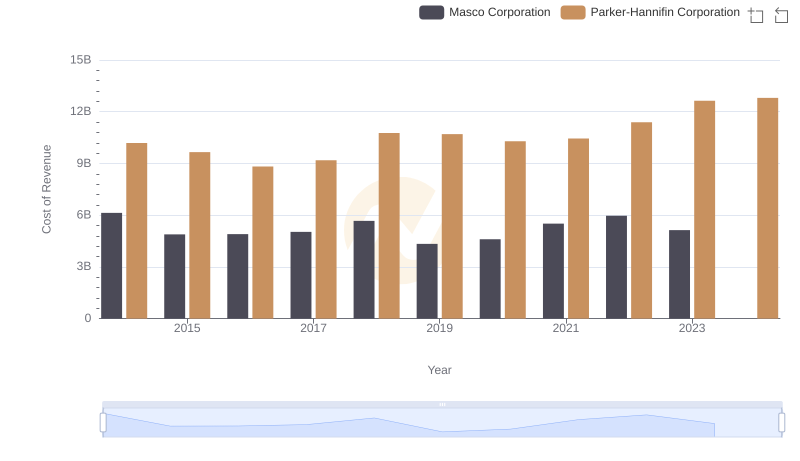
Analyzing Cost of Revenue: Parker-Hannifin Corporation and Masco Corporation
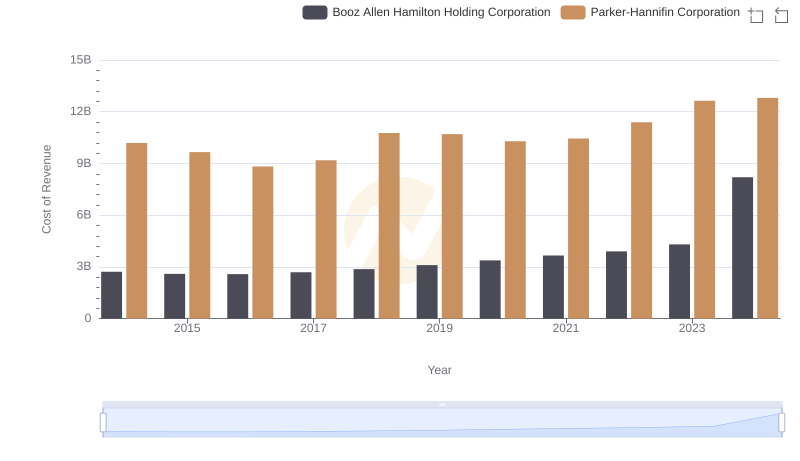
Cost Insights: Breaking Down Parker-Hannifin Corporation and Booz Allen Hamilton Holding Corporation's Expenses
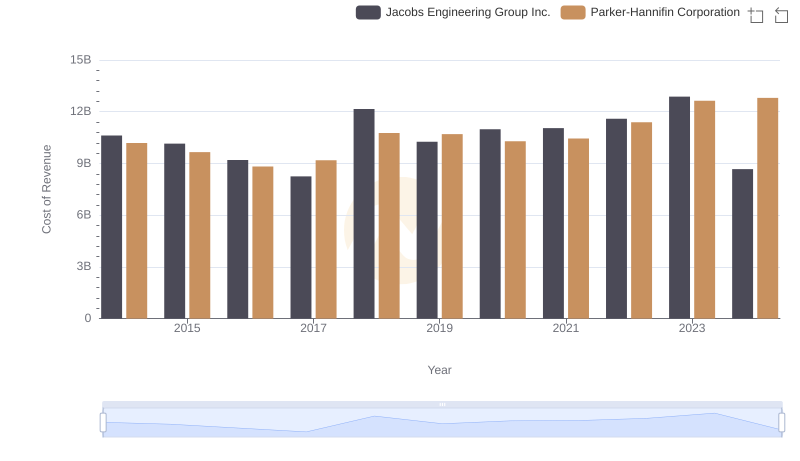
Parker-Hannifin Corporation vs Jacobs Engineering Group Inc.: Efficiency in Cost of Revenue Explored
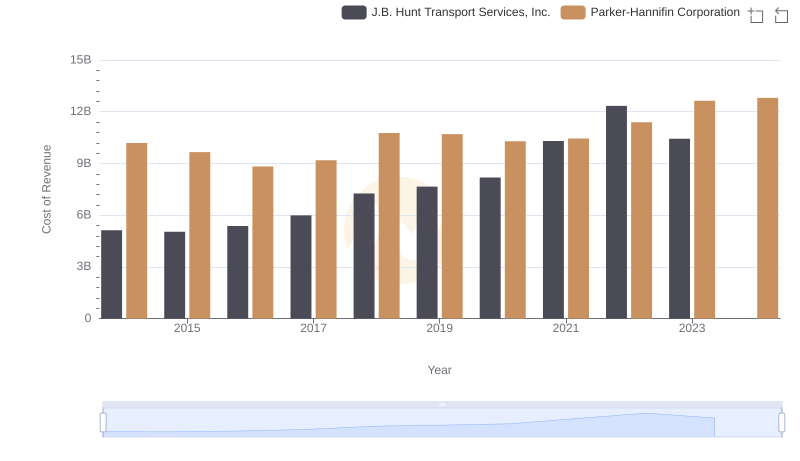
Parker-Hannifin Corporation vs J.B. Hunt Transport Services, Inc.: Efficiency in Cost of Revenue Explored
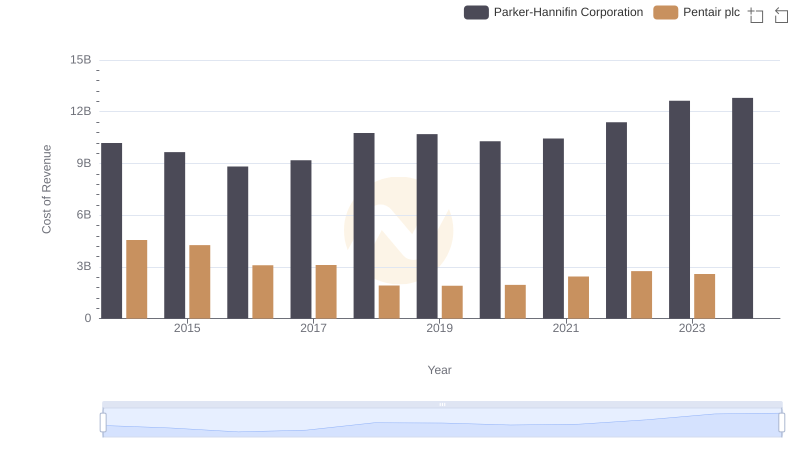
Cost Insights: Breaking Down Parker-Hannifin Corporation and Pentair plc's Expenses
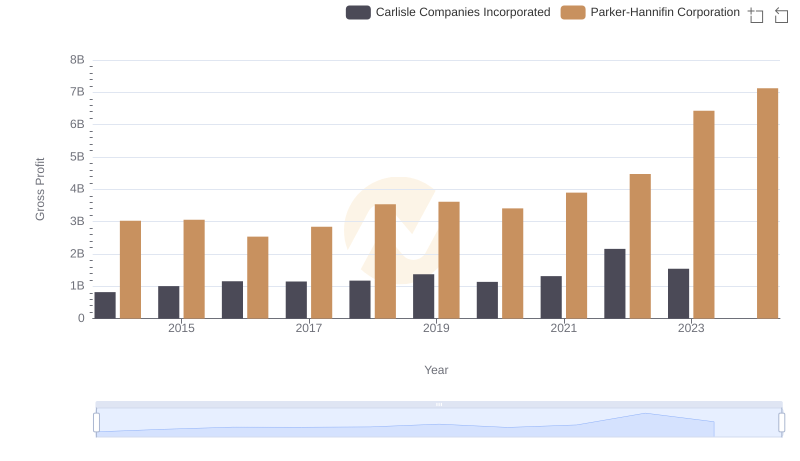
Gross Profit Trends Compared: Parker-Hannifin Corporation vs Carlisle Companies Incorporated
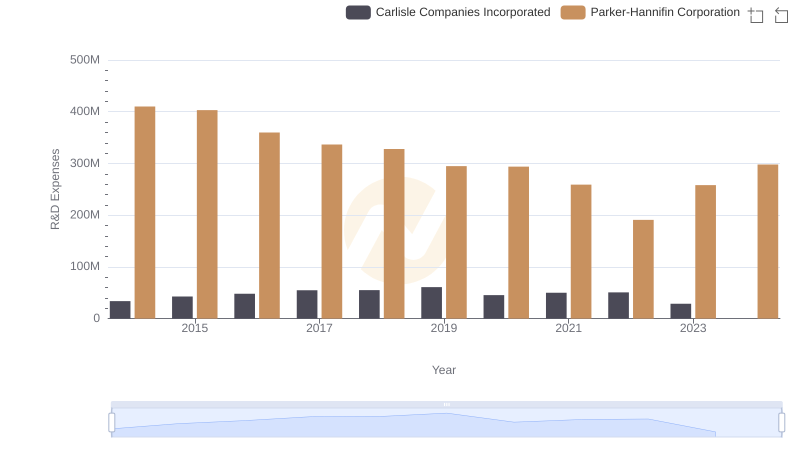
Research and Development: Comparing Key Metrics for Parker-Hannifin Corporation and Carlisle Companies Incorporated
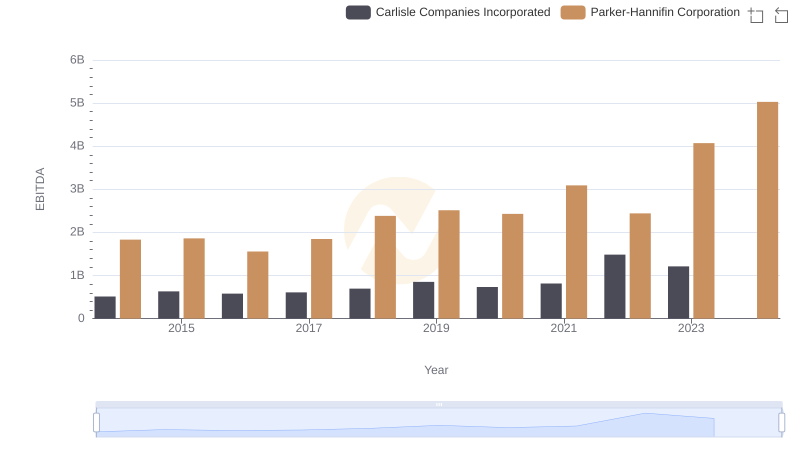
EBITDA Analysis: Evaluating Parker-Hannifin Corporation Against Carlisle Companies Incorporated