| __timestamp | International Business Machines Corporation | Workday, Inc. |
|---|---|---|
| Wednesday, January 1, 2014 | 46386000000 | 176810000 |
| Thursday, January 1, 2015 | 41057000000 | 264803000 |
| Friday, January 1, 2016 | 41403000000 | 374427000 |
| Sunday, January 1, 2017 | 42196000000 | 483545000 |
| Monday, January 1, 2018 | 42655000000 | 629413000 |
| Tuesday, January 1, 2019 | 26181000000 | 834950000 |
| Wednesday, January 1, 2020 | 24314000000 | 1065258000 |
| Friday, January 1, 2021 | 25865000000 | 1198132000 |
| Saturday, January 1, 2022 | 27842000000 | 1428095000 |
| Sunday, January 1, 2023 | 27560000000 | 1715178000 |
| Monday, January 1, 2024 | 27202000000 | 1771000000 |
Infusing magic into the data realm
In the ever-evolving landscape of technology, the cost of revenue is a critical metric that reflects a company's operational efficiency. This comparison between International Business Machines Corporation (IBM) and Workday, Inc. offers a fascinating glimpse into their financial journeys from 2014 to 2024.
IBM, a stalwart in the tech industry, has seen its cost of revenue decrease by approximately 41% over the decade. Starting at a peak in 2014, IBM's cost of revenue has steadily declined, reflecting strategic shifts and operational efficiencies.
Conversely, Workday, a cloud-based software provider, has experienced a remarkable 900% increase in its cost of revenue. This surge underscores Workday's rapid growth and expansion in the competitive tech market.
This data highlights the contrasting strategies of a legacy giant and a rising star, offering valuable insights into their financial health and market strategies.
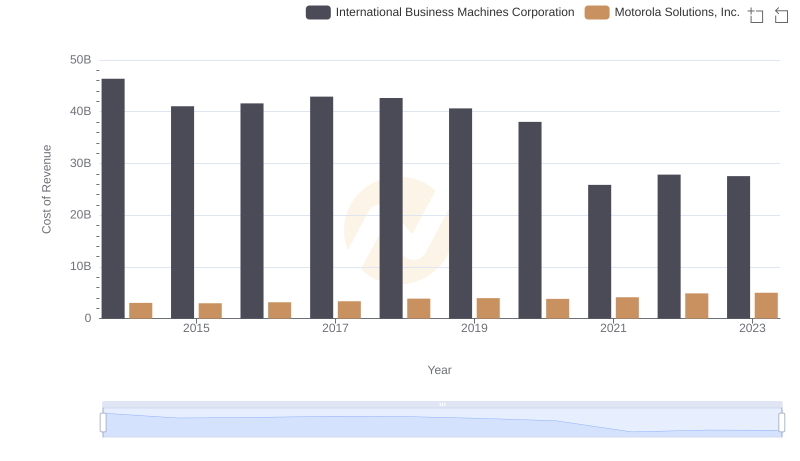
Analyzing Cost of Revenue: International Business Machines Corporation and Motorola Solutions, Inc.
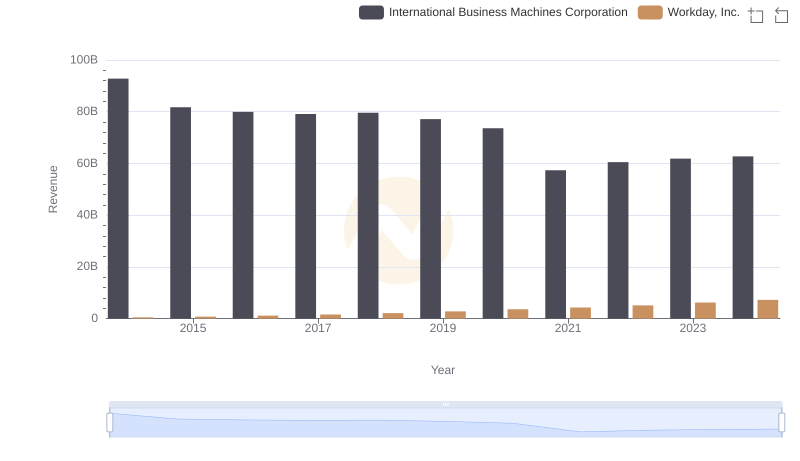
Revenue Insights: International Business Machines Corporation and Workday, Inc. Performance Compared
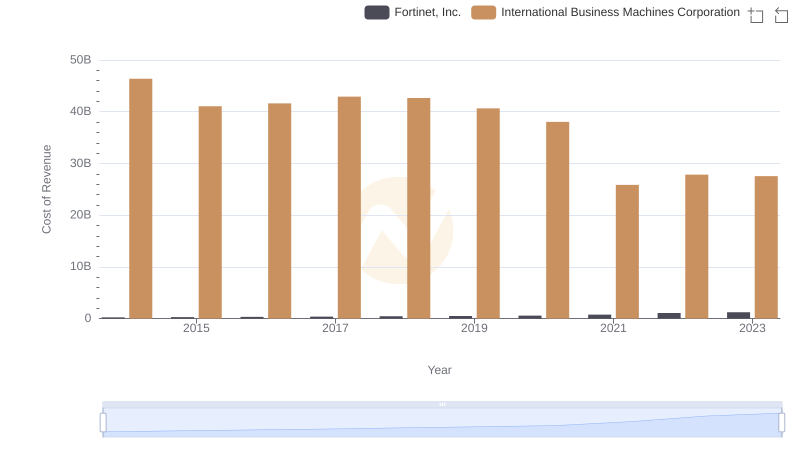
Cost Insights: Breaking Down International Business Machines Corporation and Fortinet, Inc.'s Expenses
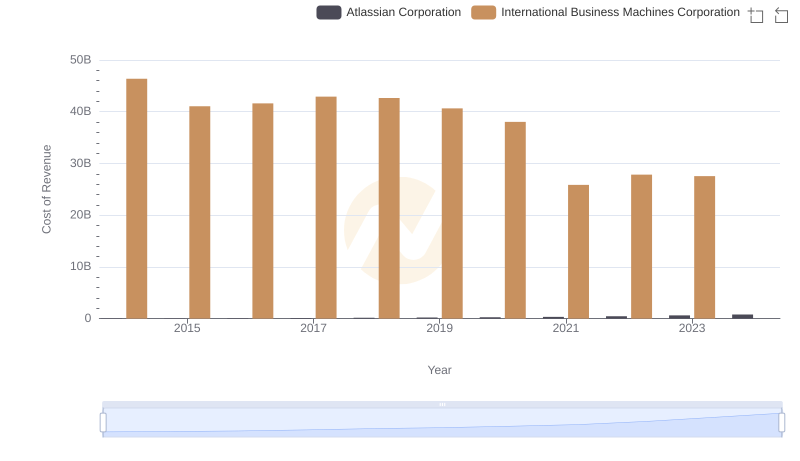
Cost of Revenue: Key Insights for International Business Machines Corporation and Atlassian Corporation
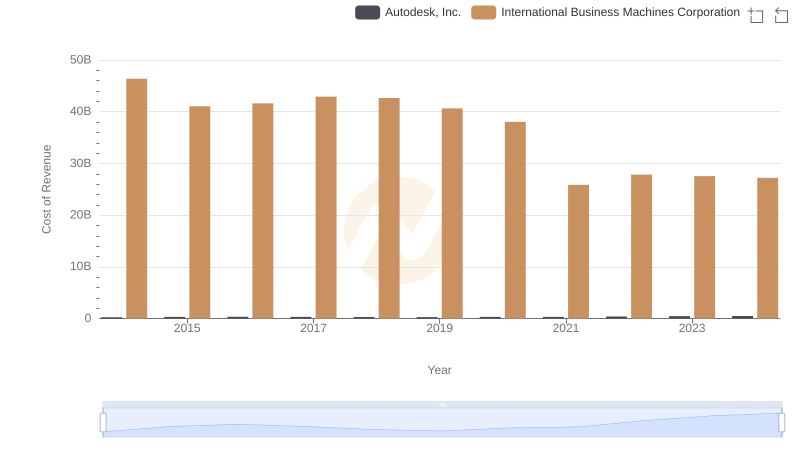
Cost of Revenue Trends: International Business Machines Corporation vs Autodesk, Inc.
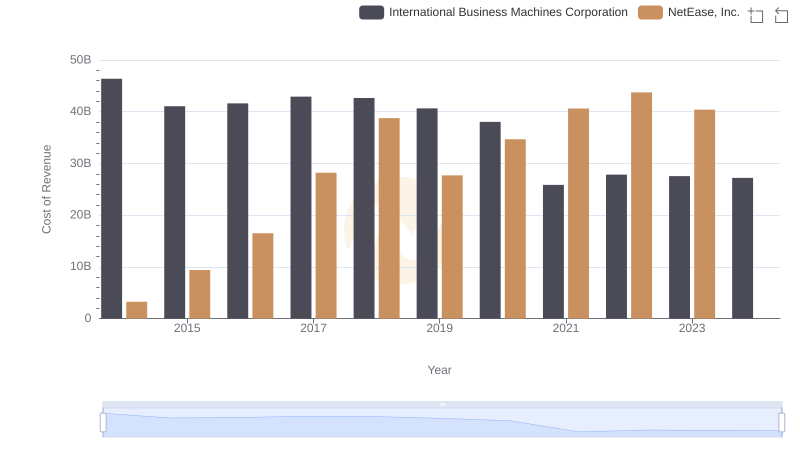
Cost of Revenue: Key Insights for International Business Machines Corporation and NetEase, Inc.
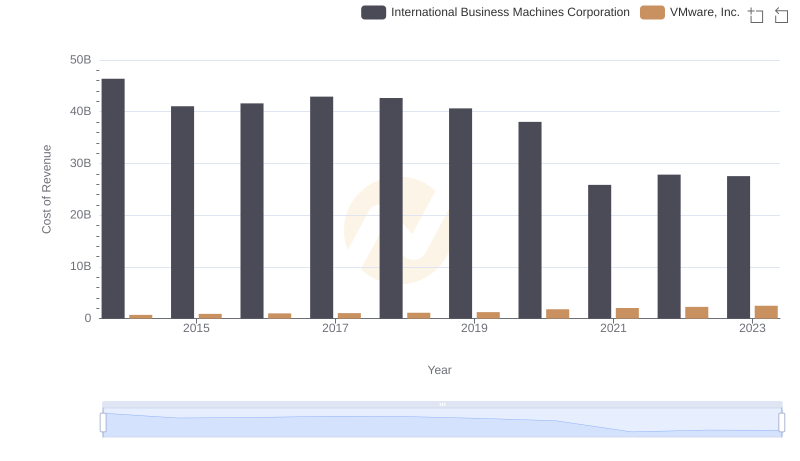
Cost of Revenue Trends: International Business Machines Corporation vs VMware, Inc.
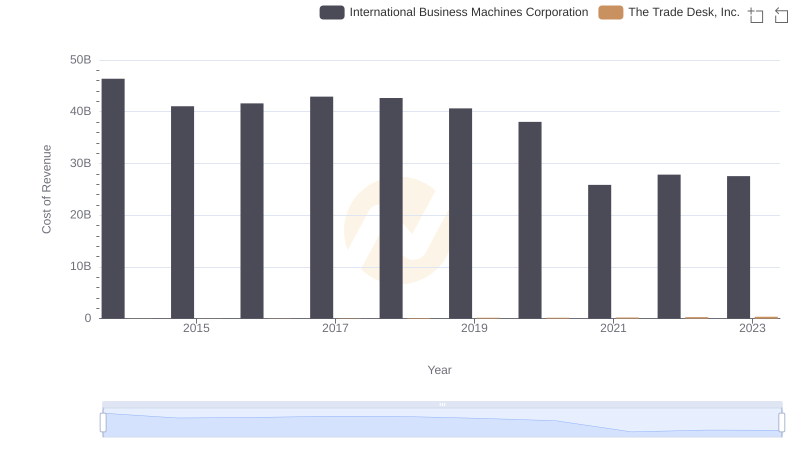
Cost Insights: Breaking Down International Business Machines Corporation and The Trade Desk, Inc.'s Expenses
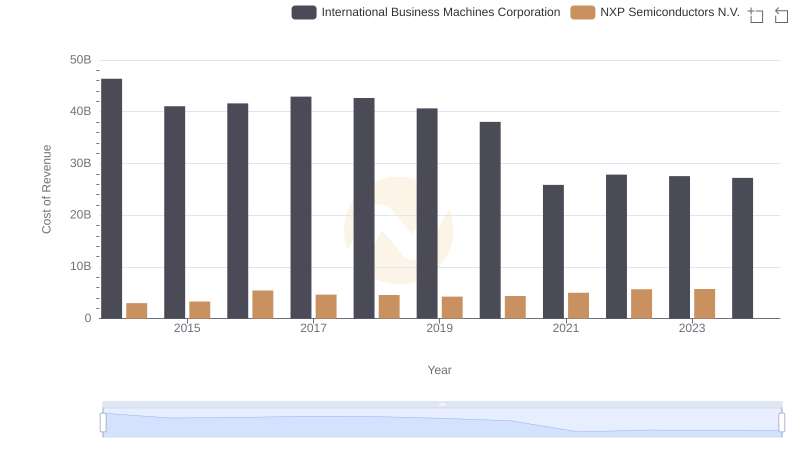
Cost of Revenue Comparison: International Business Machines Corporation vs NXP Semiconductors N.V.
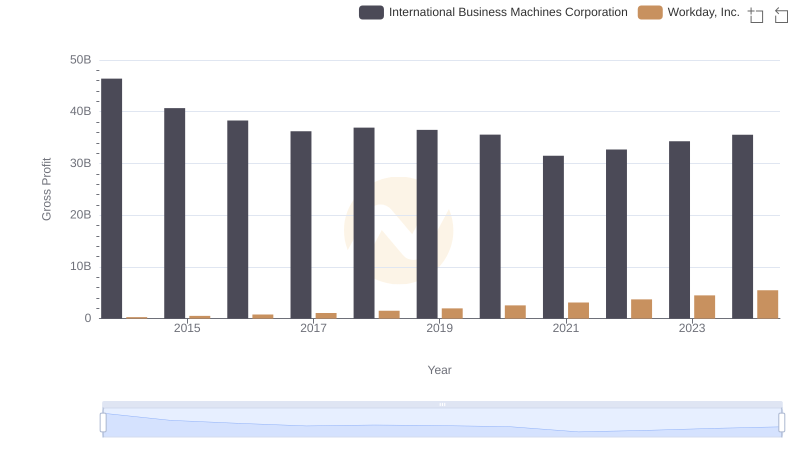
Key Insights on Gross Profit: International Business Machines Corporation vs Workday, Inc.
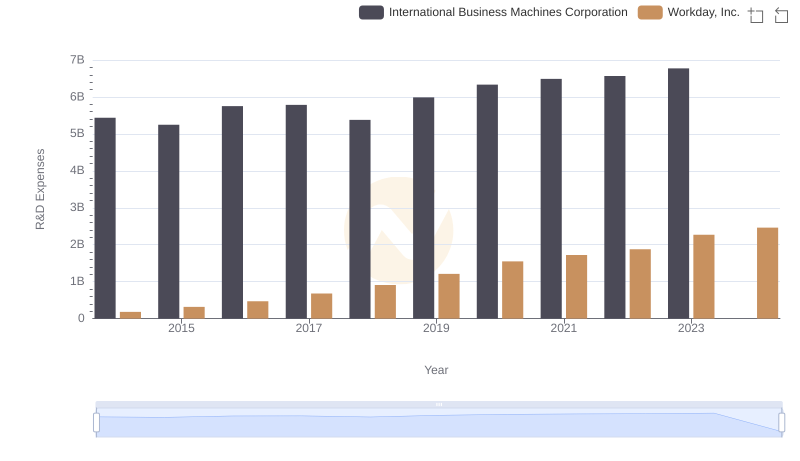
Research and Development Investment: International Business Machines Corporation vs Workday, Inc.
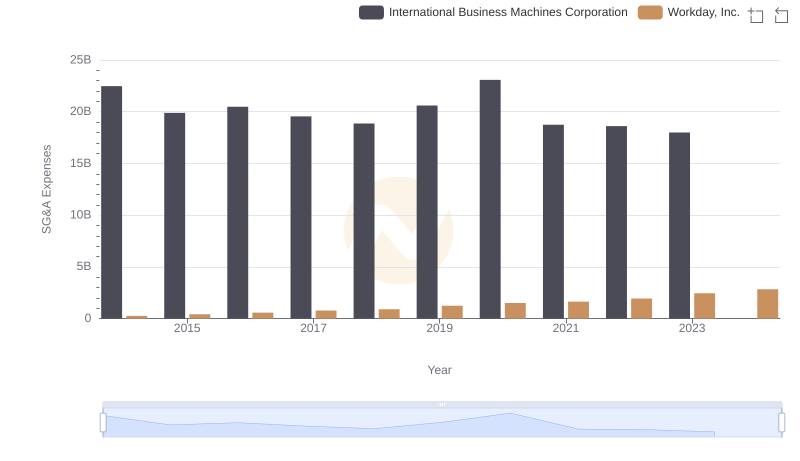
Who Optimizes SG&A Costs Better? International Business Machines Corporation or Workday, Inc.