| __timestamp | Cintas Corporation | Ferguson plc |
|---|---|---|
| Wednesday, January 1, 2014 | 2637426000 | 15995739428 |
| Thursday, January 1, 2015 | 2555549000 | 14984241894 |
| Friday, January 1, 2016 | 2775588000 | 13677144858 |
| Sunday, January 1, 2017 | 2943086000 | 14215866673 |
| Monday, January 1, 2018 | 3568109000 | 14708000000 |
| Tuesday, January 1, 2019 | 3763715000 | 15552000000 |
| Wednesday, January 1, 2020 | 3851372000 | 15398000000 |
| Friday, January 1, 2021 | 3801689000 | 15812000000 |
| Saturday, January 1, 2022 | 4222213000 | 19810000000 |
| Sunday, January 1, 2023 | 4642401000 | 20709000000 |
| Monday, January 1, 2024 | 4910199000 | 20582000000 |
Unleashing insights
In the ever-evolving landscape of corporate expenses, understanding cost structures is crucial. This analysis delves into the cost of revenue trends for Cintas Corporation and Ferguson plc from 2014 to 2024. Over this decade, Cintas Corporation's cost of revenue surged by approximately 86%, reflecting a strategic expansion and increased operational scale. In contrast, Ferguson plc, a leader in the plumbing and heating sector, saw a more modest increase of around 29% in its cost of revenue, indicating a stable yet growing market presence.
These insights offer a window into the financial strategies and market dynamics shaping these industry giants.
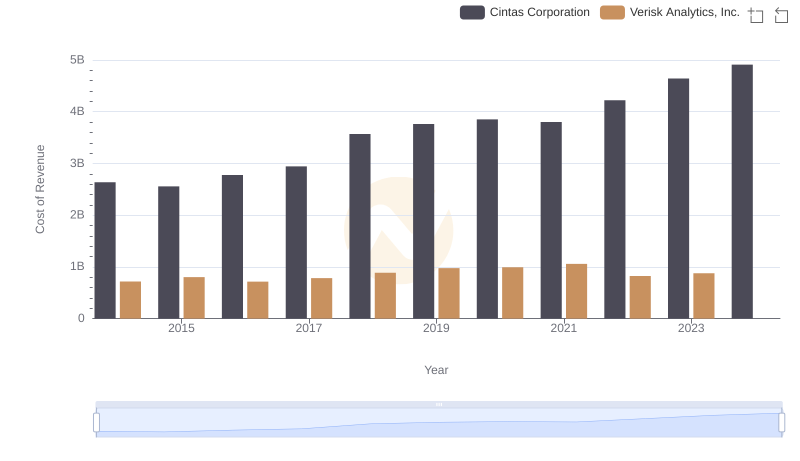
Cost Insights: Breaking Down Cintas Corporation and Verisk Analytics, Inc.'s Expenses
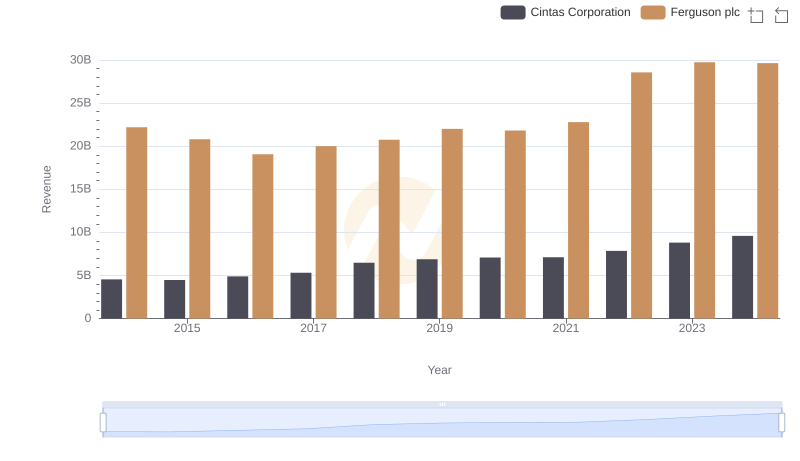
Who Generates More Revenue? Cintas Corporation or Ferguson plc
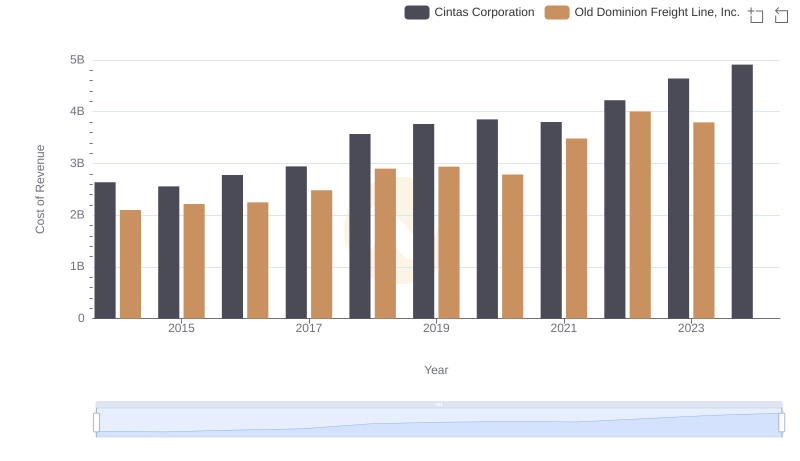
Cost Insights: Breaking Down Cintas Corporation and Old Dominion Freight Line, Inc.'s Expenses
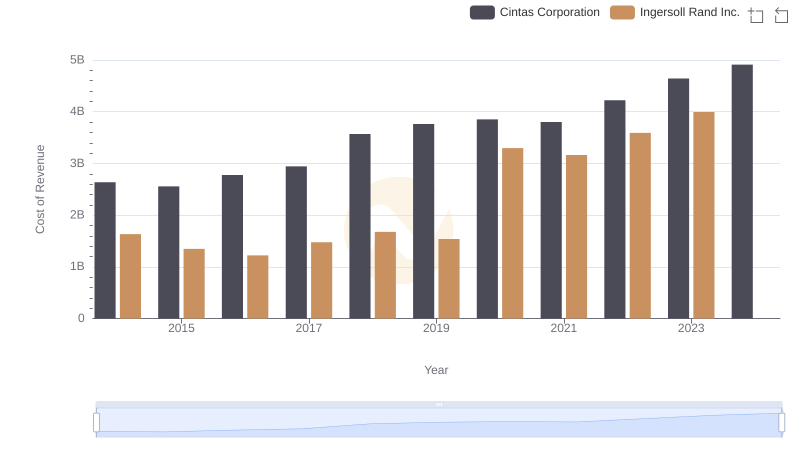
Cost Insights: Breaking Down Cintas Corporation and Ingersoll Rand Inc.'s Expenses
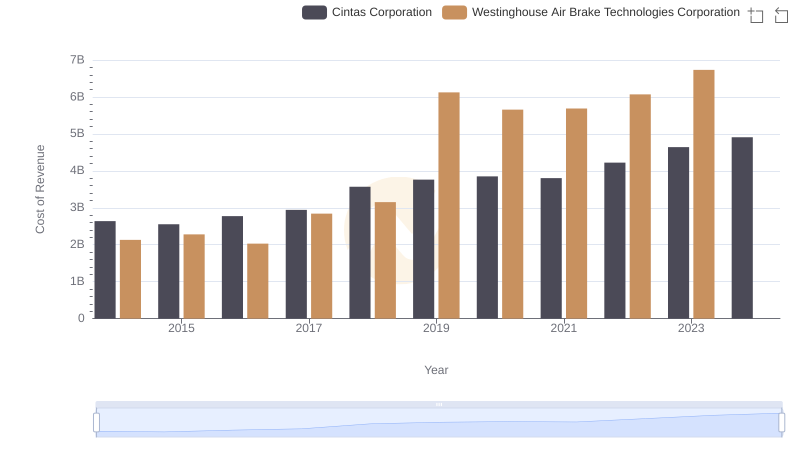
Cost of Revenue Comparison: Cintas Corporation vs Westinghouse Air Brake Technologies Corporation

Cintas Corporation vs United Airlines Holdings, Inc.: Efficiency in Cost of Revenue Explored
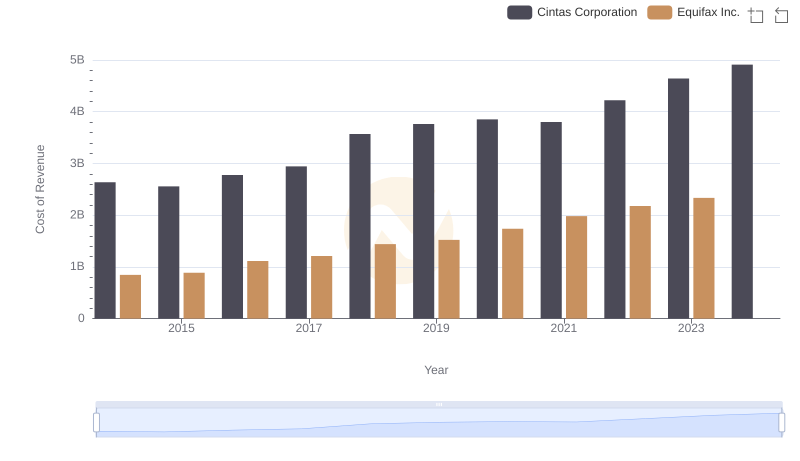
Cost of Revenue Trends: Cintas Corporation vs Equifax Inc.
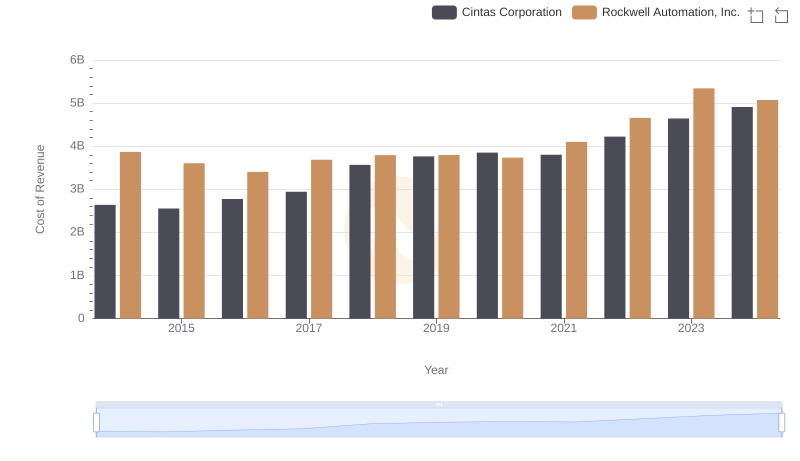
Cost of Revenue Comparison: Cintas Corporation vs Rockwell Automation, Inc.
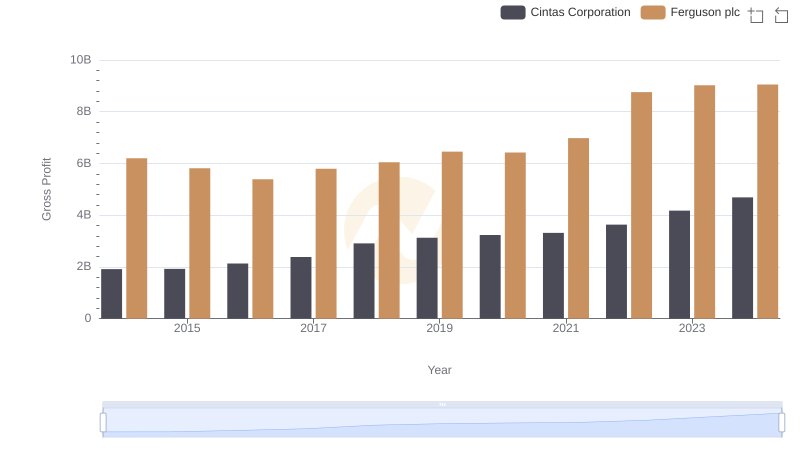
Gross Profit Trends Compared: Cintas Corporation vs Ferguson plc
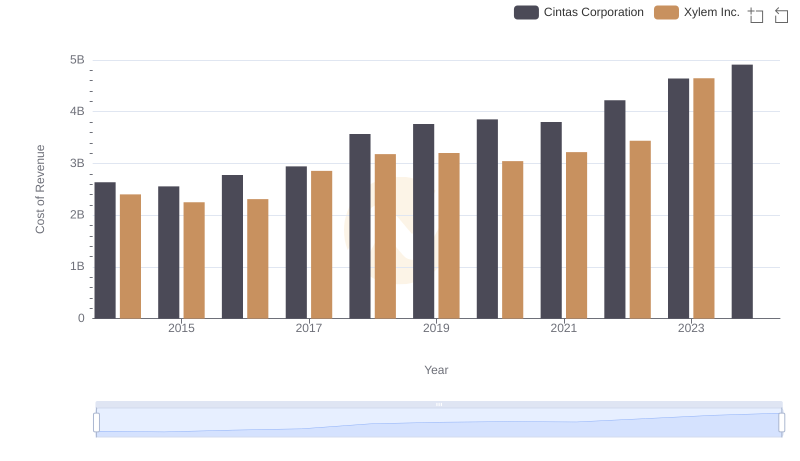
Cost Insights: Breaking Down Cintas Corporation and Xylem Inc.'s Expenses
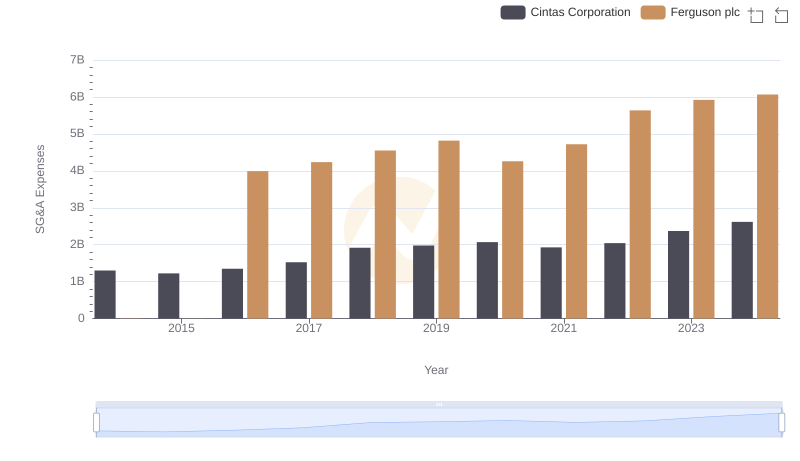
Selling, General, and Administrative Costs: Cintas Corporation vs Ferguson plc
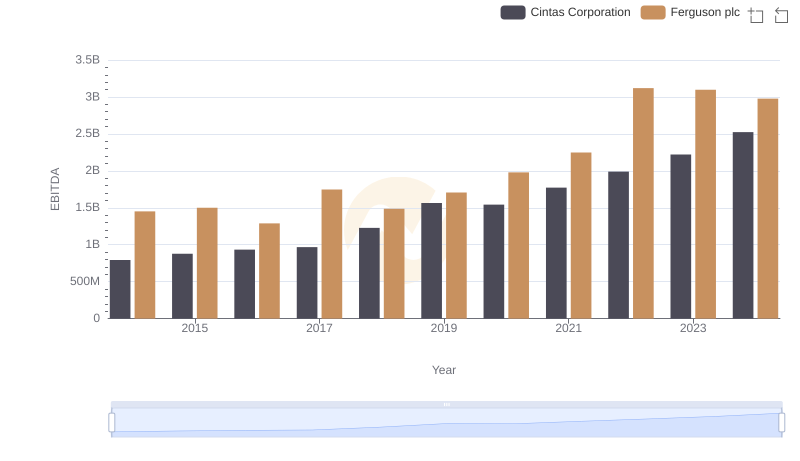
A Professional Review of EBITDA: Cintas Corporation Compared to Ferguson plc