| __timestamp | Cintas Corporation | Xylem Inc. |
|---|---|---|
| Wednesday, January 1, 2014 | 2637426000 | 2403000000 |
| Thursday, January 1, 2015 | 2555549000 | 2249000000 |
| Friday, January 1, 2016 | 2775588000 | 2310000000 |
| Sunday, January 1, 2017 | 2943086000 | 2856000000 |
| Monday, January 1, 2018 | 3568109000 | 3181000000 |
| Tuesday, January 1, 2019 | 3763715000 | 3203000000 |
| Wednesday, January 1, 2020 | 3851372000 | 3046000000 |
| Friday, January 1, 2021 | 3801689000 | 3220000000 |
| Saturday, January 1, 2022 | 4222213000 | 3438000000 |
| Sunday, January 1, 2023 | 4642401000 | 4647000000 |
| Monday, January 1, 2024 | 4910199000 |
Unlocking the unknown
In the ever-evolving landscape of corporate finance, understanding cost structures is crucial. This analysis delves into the cost of revenue trends for Cintas Corporation and Xylem Inc. from 2014 to 2023. Over this decade, Cintas Corporation's cost of revenue surged by approximately 86%, peaking at $4.91 billion in 2024. Meanwhile, Xylem Inc. experienced a 93% increase, reaching $4.65 billion in 2023. Notably, Cintas consistently outpaced Xylem in cost growth, except in 2023 when Xylem briefly surpassed. This data highlights the dynamic nature of operational expenses in the industrial sector, reflecting broader economic shifts and strategic corporate decisions. Missing data for Xylem in 2024 suggests potential reporting delays or strategic changes. As businesses navigate these financial waters, understanding such trends is vital for stakeholders aiming to optimize performance and investment strategies.
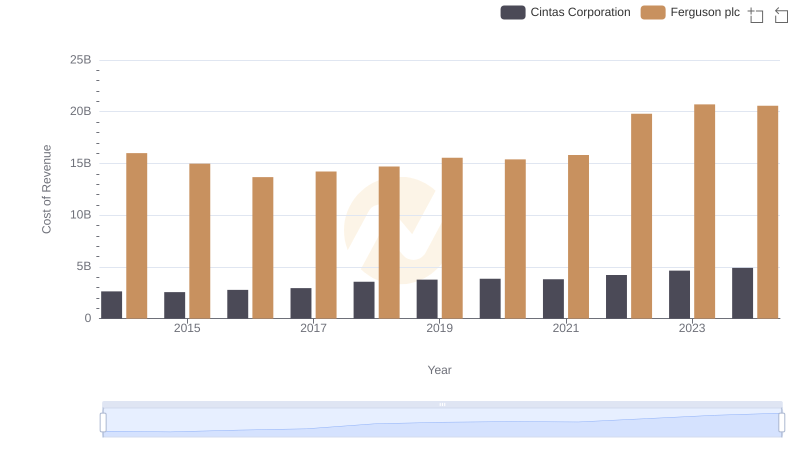
Cost Insights: Breaking Down Cintas Corporation and Ferguson plc's Expenses
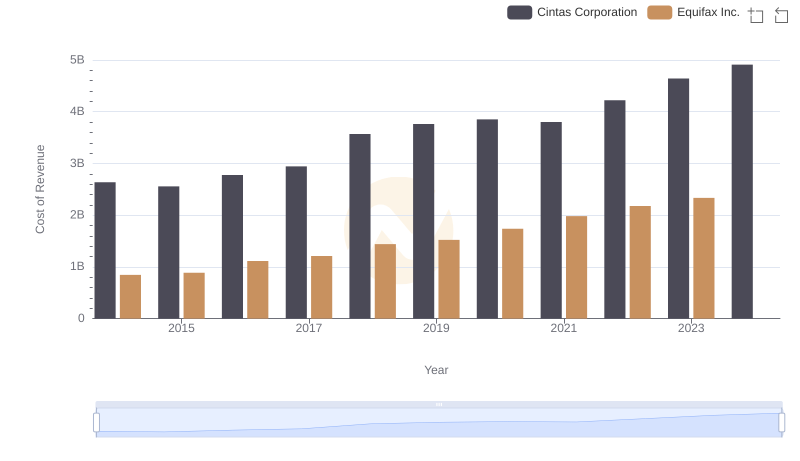
Cost of Revenue Trends: Cintas Corporation vs Equifax Inc.
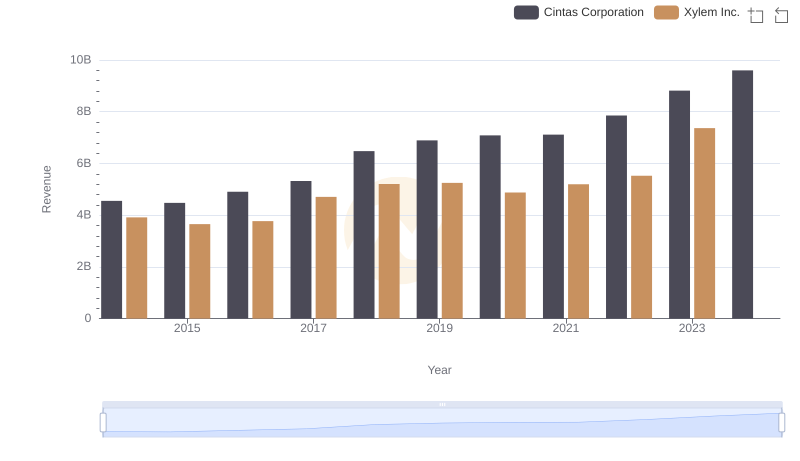
Breaking Down Revenue Trends: Cintas Corporation vs Xylem Inc.
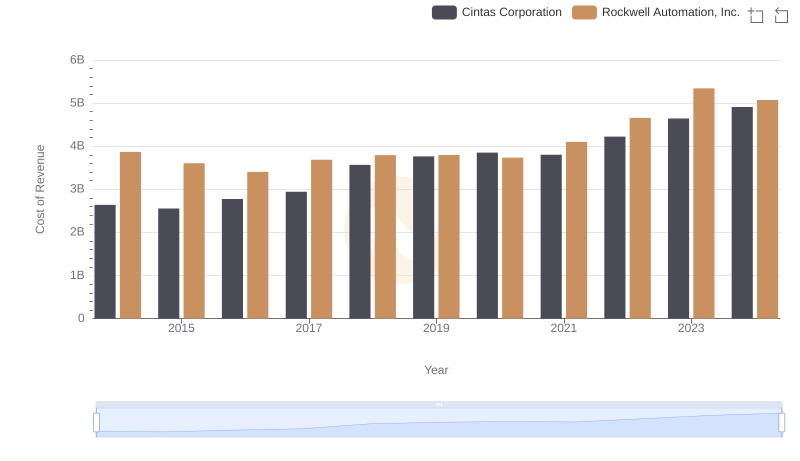
Cost of Revenue Comparison: Cintas Corporation vs Rockwell Automation, Inc.
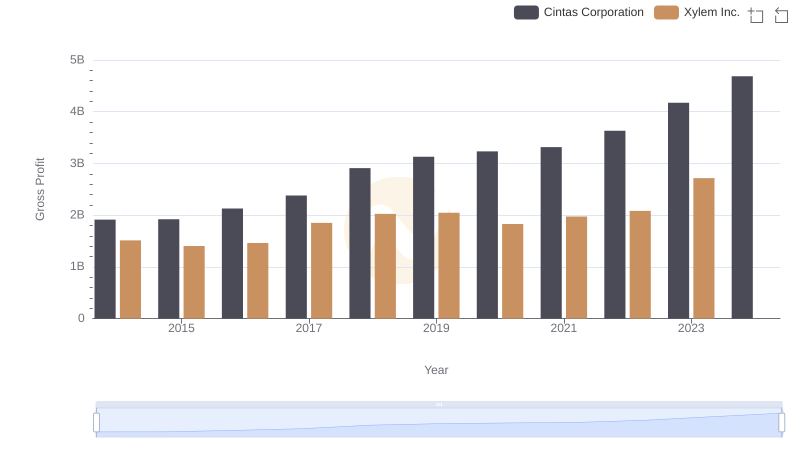
Gross Profit Analysis: Comparing Cintas Corporation and Xylem Inc.
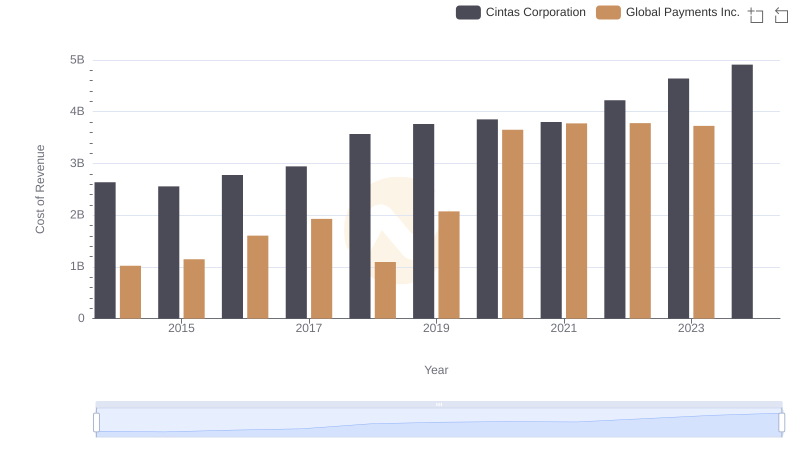
Comparing Cost of Revenue Efficiency: Cintas Corporation vs Global Payments Inc.
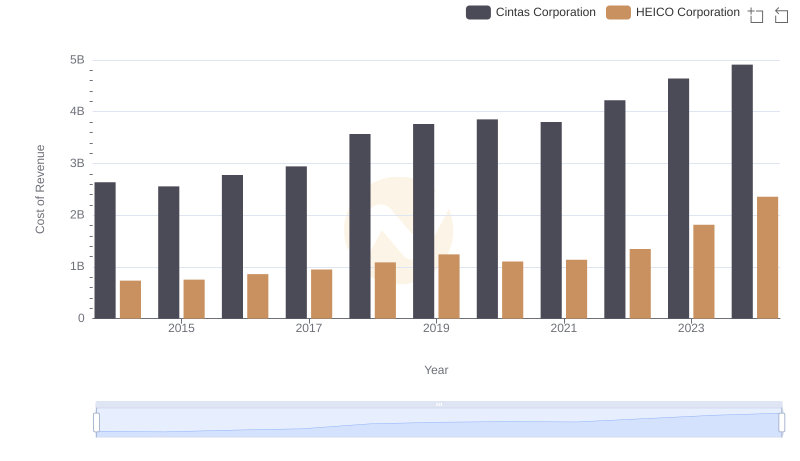
Cintas Corporation vs HEICO Corporation: Efficiency in Cost of Revenue Explored
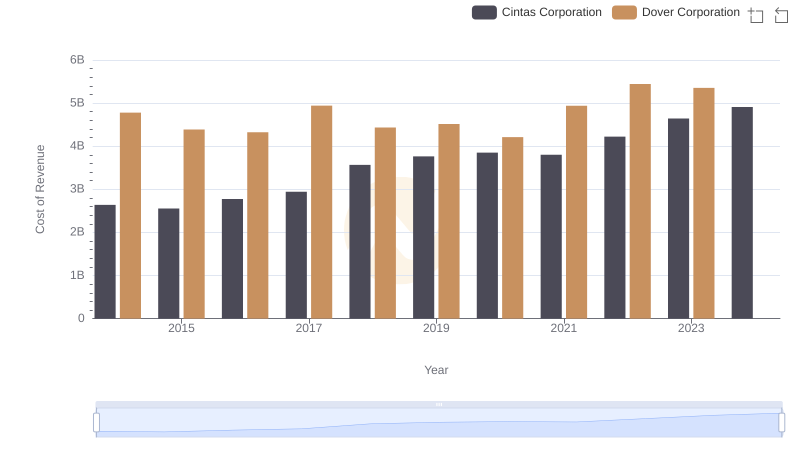
Cost of Revenue Trends: Cintas Corporation vs Dover Corporation
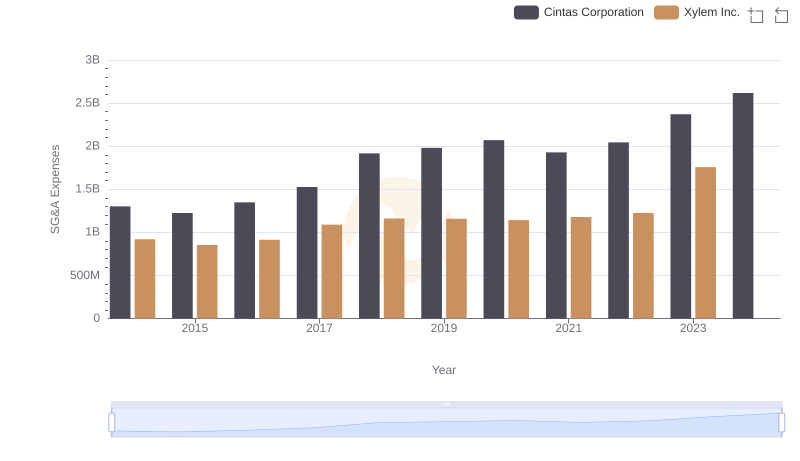
Cintas Corporation or Xylem Inc.: Who Manages SG&A Costs Better?
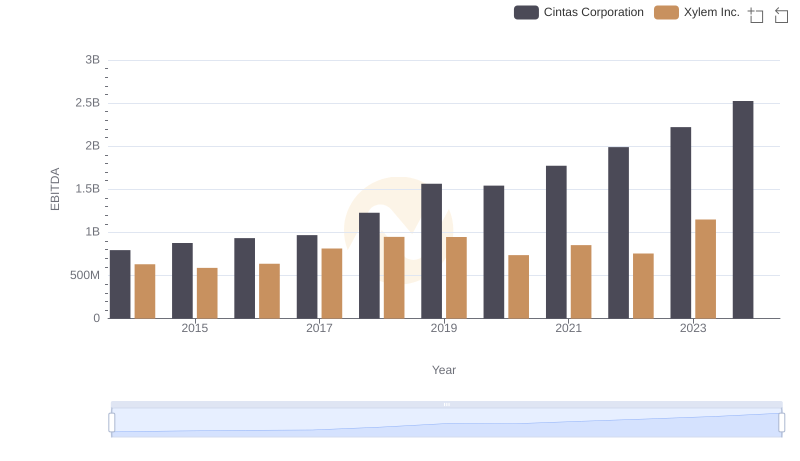
Professional EBITDA Benchmarking: Cintas Corporation vs Xylem Inc.