| __timestamp | Axon Enterprise, Inc. | CNH Industrial N.V. |
|---|---|---|
| Wednesday, January 1, 2014 | 164525000 | 32555000000 |
| Thursday, January 1, 2015 | 197892000 | 25912000000 |
| Friday, January 1, 2016 | 268245000 | 24872000000 |
| Sunday, January 1, 2017 | 343798000 | 27361000000 |
| Monday, January 1, 2018 | 420068000 | 29706000000 |
| Tuesday, January 1, 2019 | 530860000 | 28079000000 |
| Wednesday, January 1, 2020 | 681003000 | 26032000000 |
| Friday, January 1, 2021 | 863381000 | 33428000000 |
| Saturday, January 1, 2022 | 1189935000 | 23551000000 |
| Sunday, January 1, 2023 | 1563391000 | 24694000000 |
Unleashing insights
In the ever-evolving landscape of global industries, Axon Enterprise, Inc. and CNH Industrial N.V. stand as titans in their respective fields. Over the past decade, these companies have showcased remarkable growth trajectories, albeit on different scales. Axon, a leader in public safety technology, has seen its revenue skyrocket by nearly 850% from 2014 to 2023, reflecting its innovative edge and expanding market reach. In contrast, CNH Industrial, a powerhouse in capital goods, experienced a more modest revenue fluctuation, with a peak in 2021 and a subsequent dip by 2023.
This comparison highlights the dynamic nature of industry-specific growth. While Axon's revenue growth underscores the increasing demand for tech-driven safety solutions, CNH's figures reflect the cyclical nature of the capital goods sector. As we delve deeper into these metrics, the narrative of innovation versus stability unfolds, offering valuable insights for investors and industry enthusiasts alike.
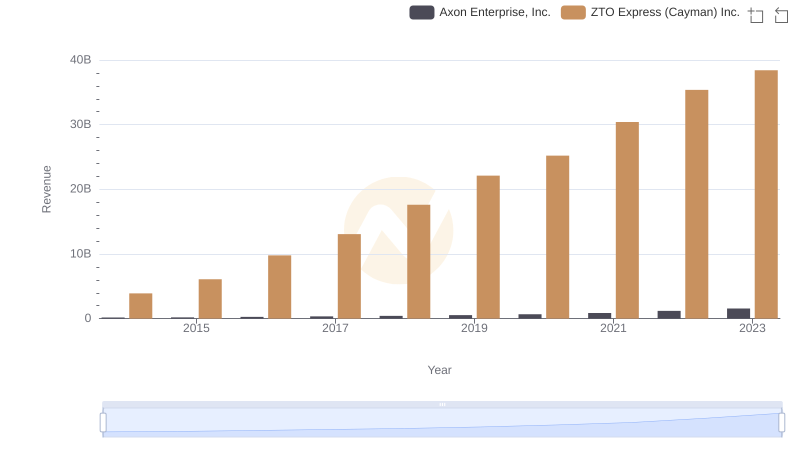
Breaking Down Revenue Trends: Axon Enterprise, Inc. vs ZTO Express (Cayman) Inc.

Axon Enterprise, Inc. or Textron Inc.: Who Leads in Yearly Revenue?
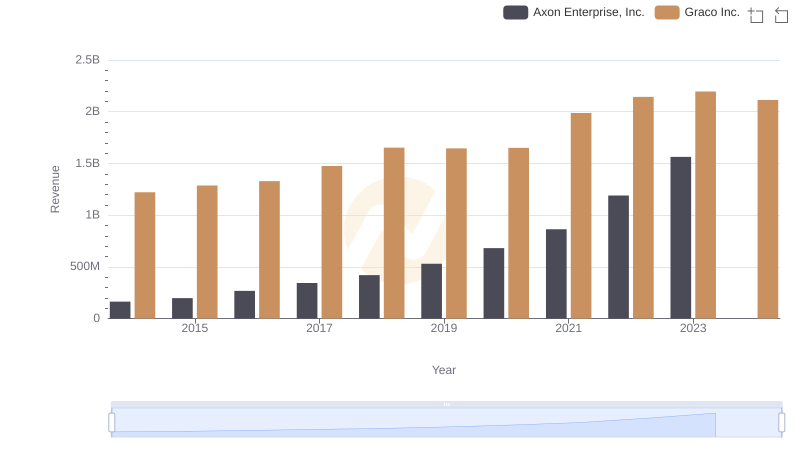
Axon Enterprise, Inc. vs Graco Inc.: Examining Key Revenue Metrics
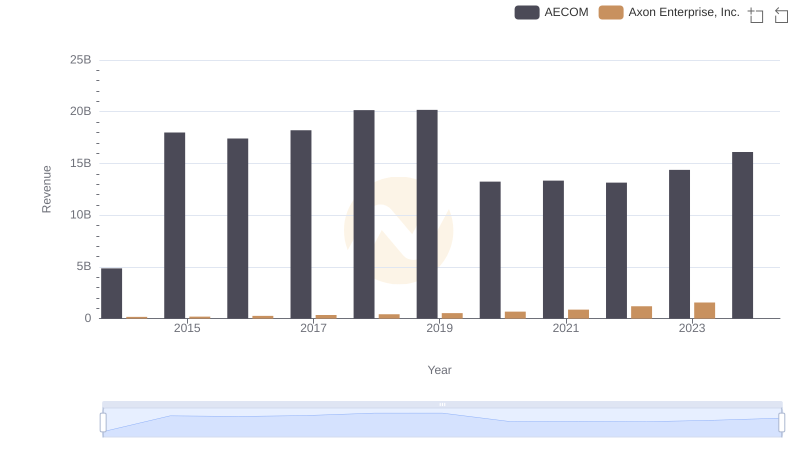
Who Generates More Revenue? Axon Enterprise, Inc. or AECOM
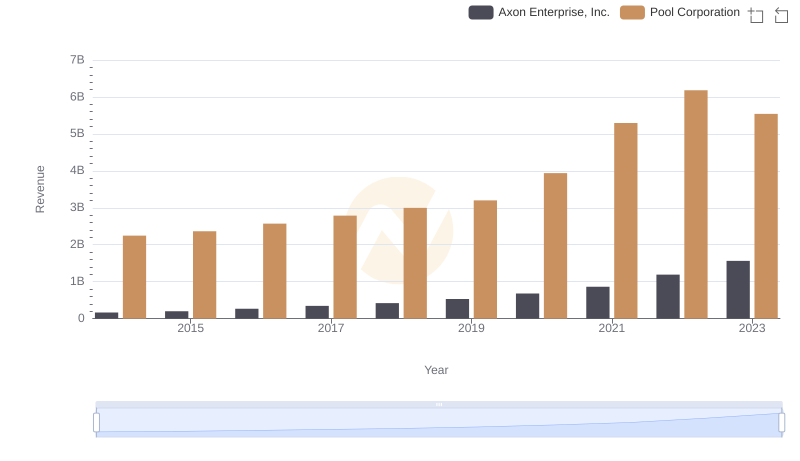
Axon Enterprise, Inc. vs Pool Corporation: Annual Revenue Growth Compared
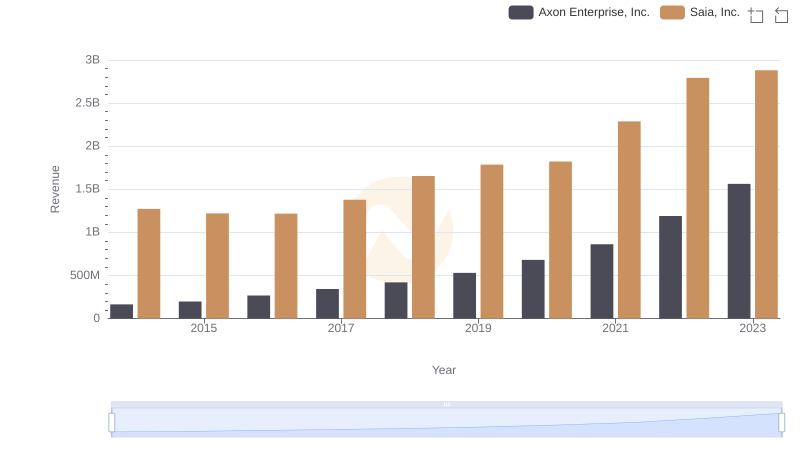
Axon Enterprise, Inc. or Saia, Inc.: Who Leads in Yearly Revenue?
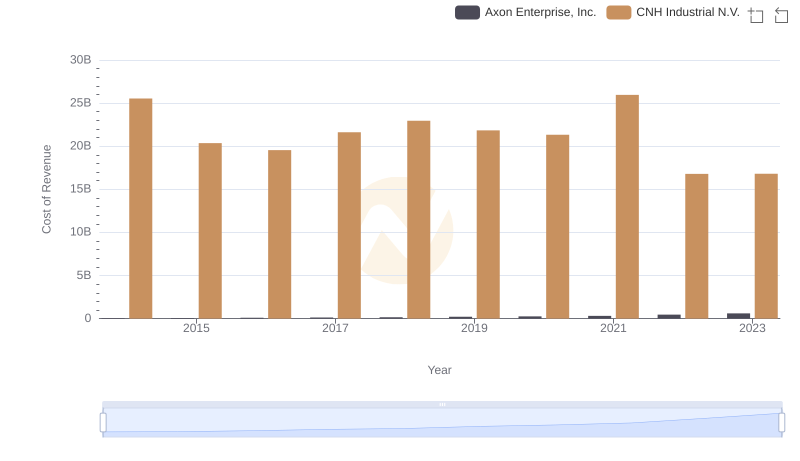
Cost Insights: Breaking Down Axon Enterprise, Inc. and CNH Industrial N.V.'s Expenses
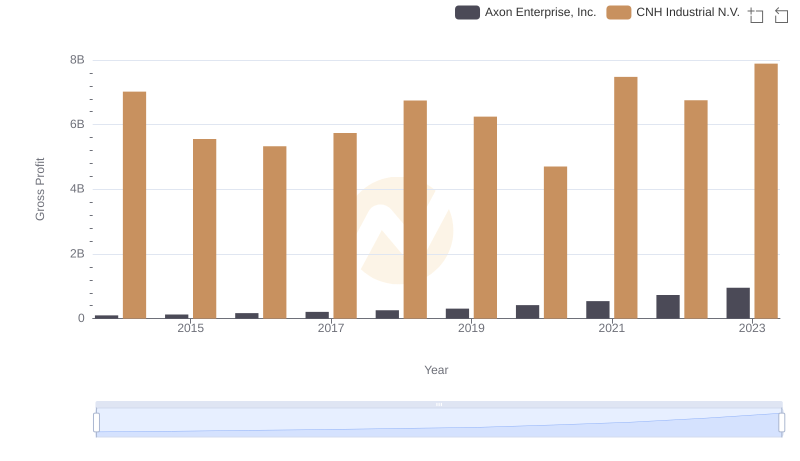
Who Generates Higher Gross Profit? Axon Enterprise, Inc. or CNH Industrial N.V.
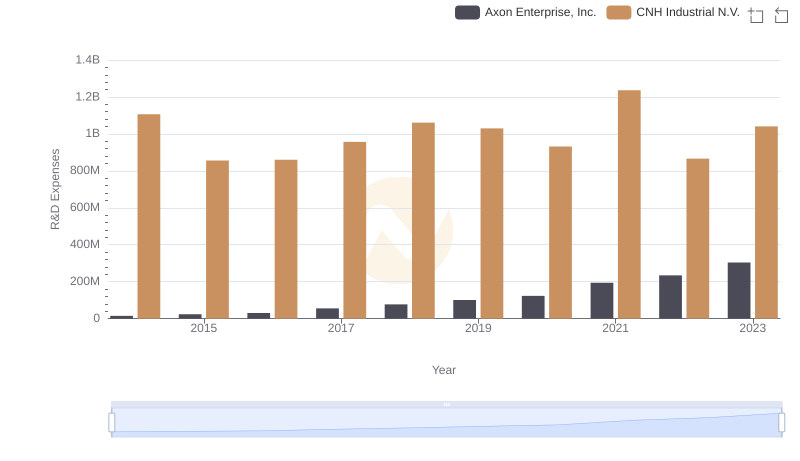
Axon Enterprise, Inc. or CNH Industrial N.V.: Who Invests More in Innovation?
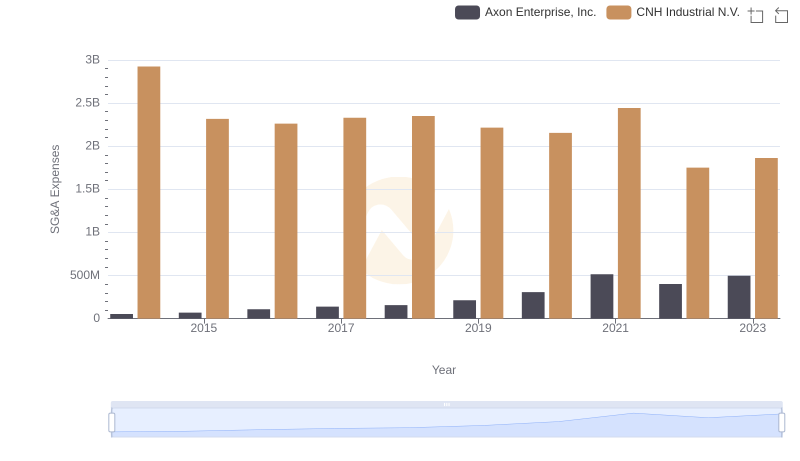
Operational Costs Compared: SG&A Analysis of Axon Enterprise, Inc. and CNH Industrial N.V.