| __timestamp | Axon Enterprise, Inc. | ZTO Express (Cayman) Inc. |
|---|---|---|
| Wednesday, January 1, 2014 | 62977000 | 2770530000 |
| Thursday, January 1, 2015 | 69245000 | 3998737000 |
| Friday, January 1, 2016 | 97709000 | 6345899000 |
| Sunday, January 1, 2017 | 136710000 | 8714489000 |
| Monday, January 1, 2018 | 161485000 | 12239568000 |
| Tuesday, January 1, 2019 | 223574000 | 15488778000 |
| Wednesday, January 1, 2020 | 264672000 | 19377184000 |
| Friday, January 1, 2021 | 322471000 | 23816462000 |
| Saturday, January 1, 2022 | 461297000 | 26337721000 |
| Sunday, January 1, 2023 | 608009000 | 26756389000 |
Unveiling the hidden dimensions of data
In the ever-evolving landscape of global commerce, understanding the cost of revenue is crucial for investors and analysts alike. This chart provides a fascinating glimpse into the financial journeys of Axon Enterprise, Inc. and ZTO Express (Cayman) Inc. over the past decade.
From 2014 to 2023, Axon Enterprise, Inc. has seen its cost of revenue grow by nearly 900%, reflecting its expanding footprint in the public safety technology sector. Meanwhile, ZTO Express, a leader in China's express delivery industry, has experienced a staggering 866% increase in its cost of revenue, underscoring the rapid growth of e-commerce in Asia.
These trends highlight the dynamic nature of these industries and the strategic investments made by these companies to capture market share. As we look to the future, understanding these financial metrics will be key to predicting the next wave of industry leaders.
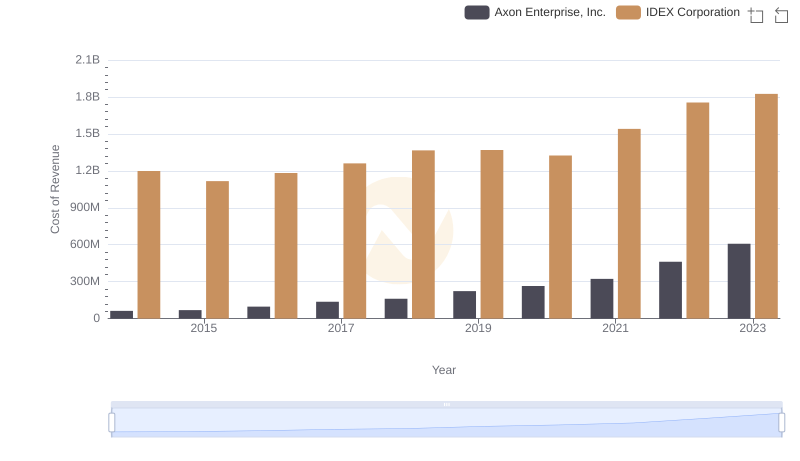
Comparing Cost of Revenue Efficiency: Axon Enterprise, Inc. vs IDEX Corporation
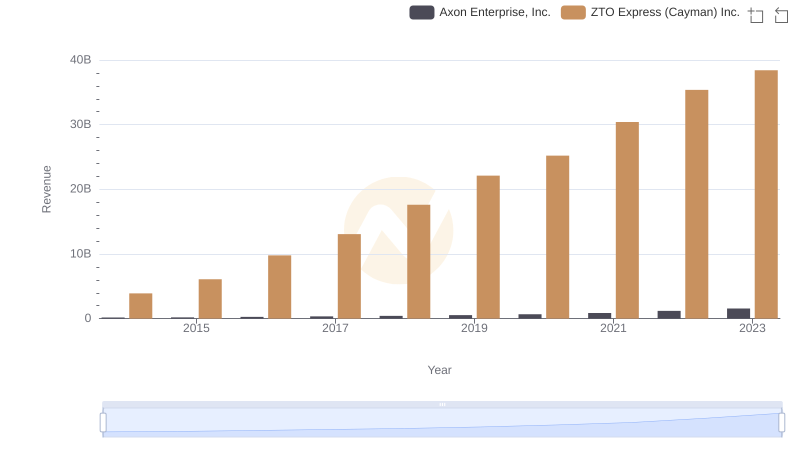
Breaking Down Revenue Trends: Axon Enterprise, Inc. vs ZTO Express (Cayman) Inc.
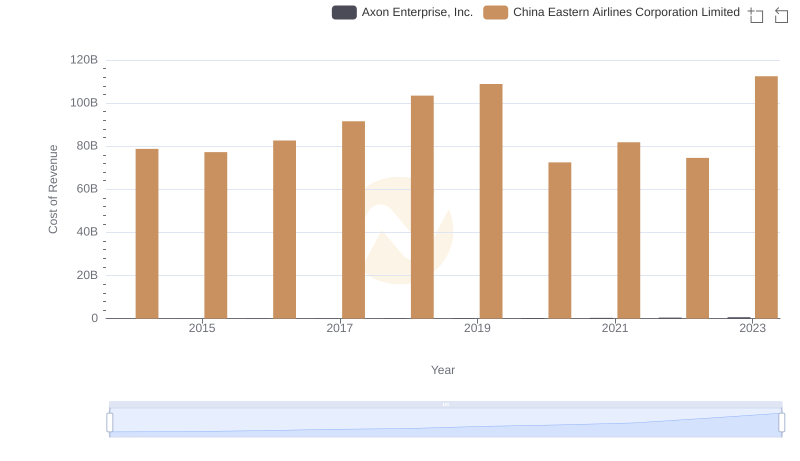
Cost Insights: Breaking Down Axon Enterprise, Inc. and China Eastern Airlines Corporation Limited's Expenses
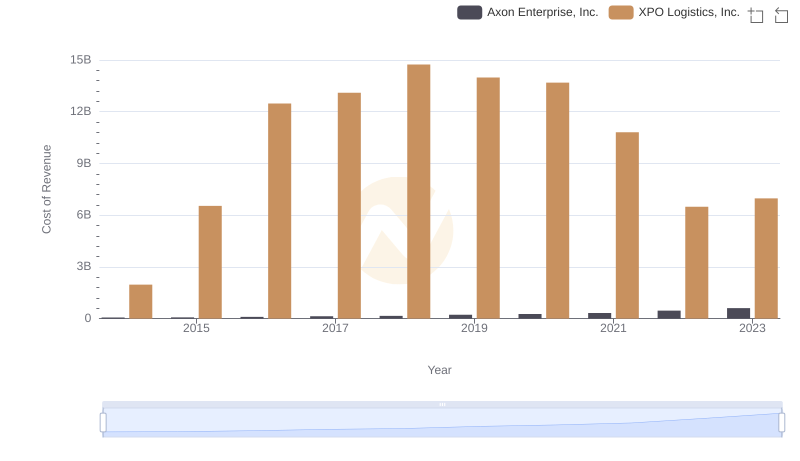
Comparing Cost of Revenue Efficiency: Axon Enterprise, Inc. vs XPO Logistics, Inc.
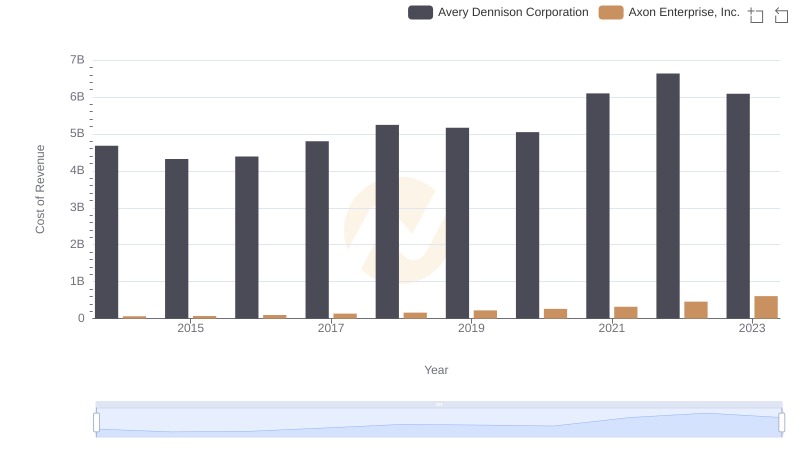
Comparing Cost of Revenue Efficiency: Axon Enterprise, Inc. vs Avery Dennison Corporation
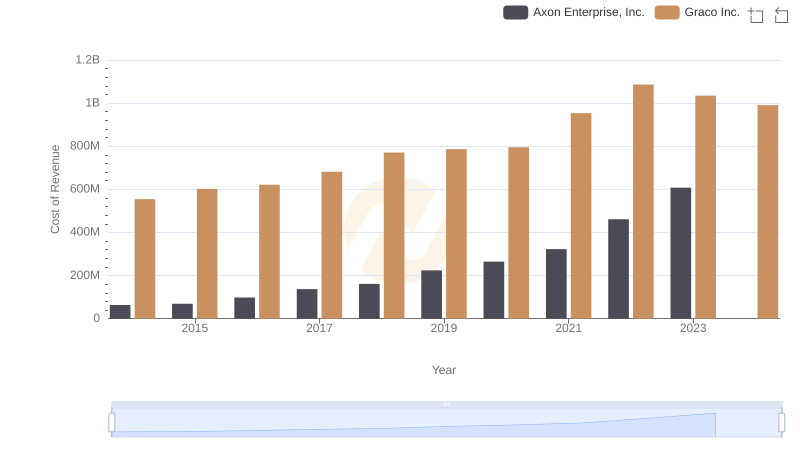
Axon Enterprise, Inc. vs Graco Inc.: Efficiency in Cost of Revenue Explored
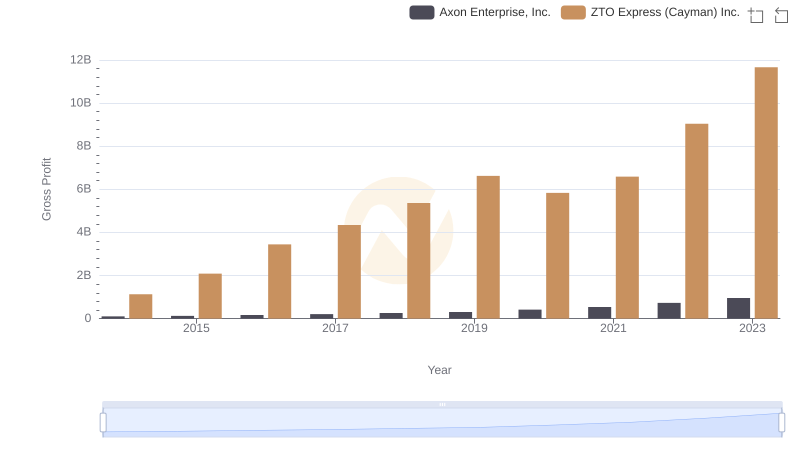
Axon Enterprise, Inc. and ZTO Express (Cayman) Inc.: A Detailed Gross Profit Analysis
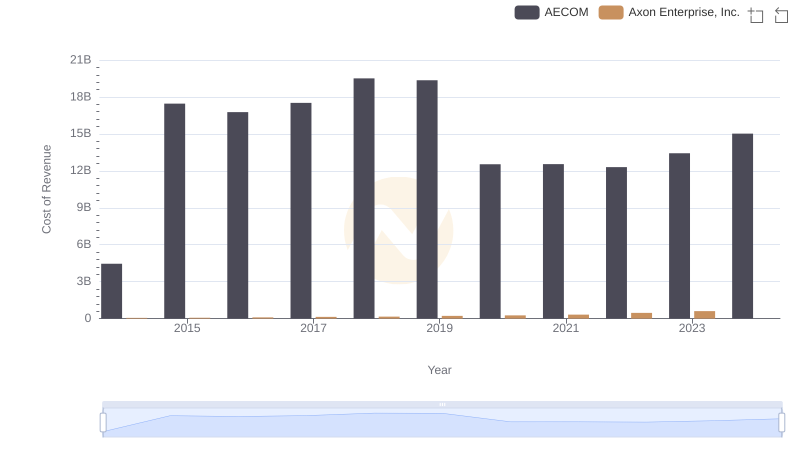
Comparing Cost of Revenue Efficiency: Axon Enterprise, Inc. vs AECOM
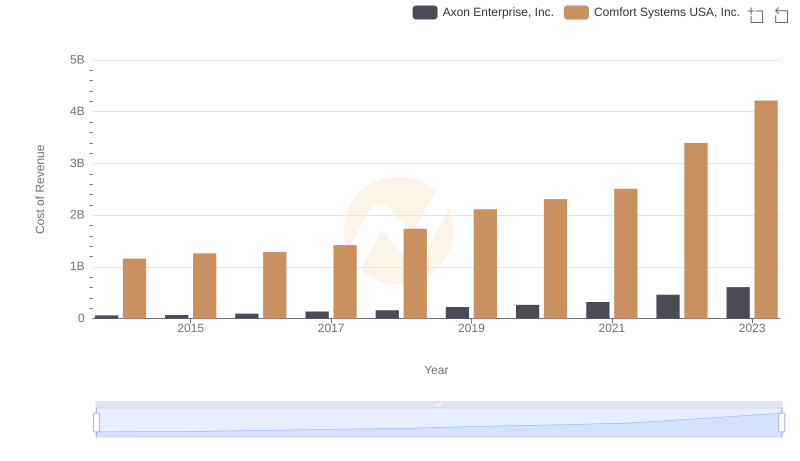
Analyzing Cost of Revenue: Axon Enterprise, Inc. and Comfort Systems USA, Inc.
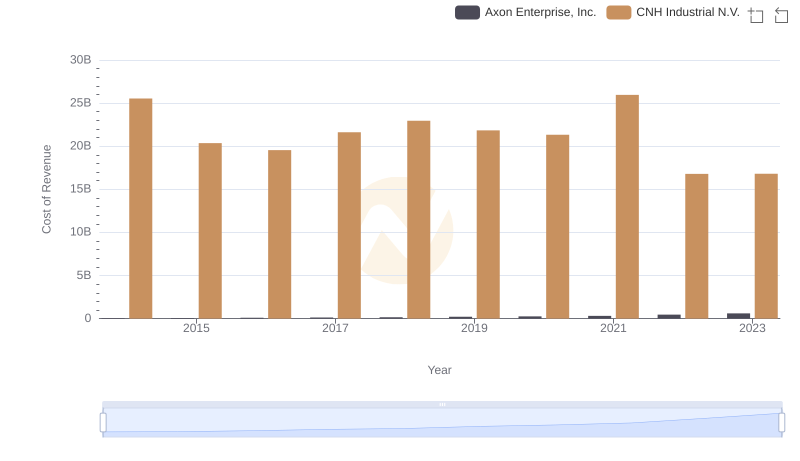
Cost Insights: Breaking Down Axon Enterprise, Inc. and CNH Industrial N.V.'s Expenses
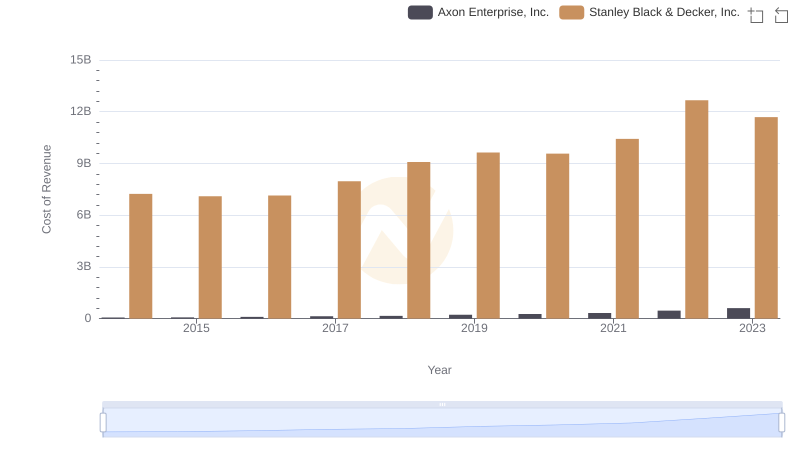
Cost Insights: Breaking Down Axon Enterprise, Inc. and Stanley Black & Decker, Inc.'s Expenses
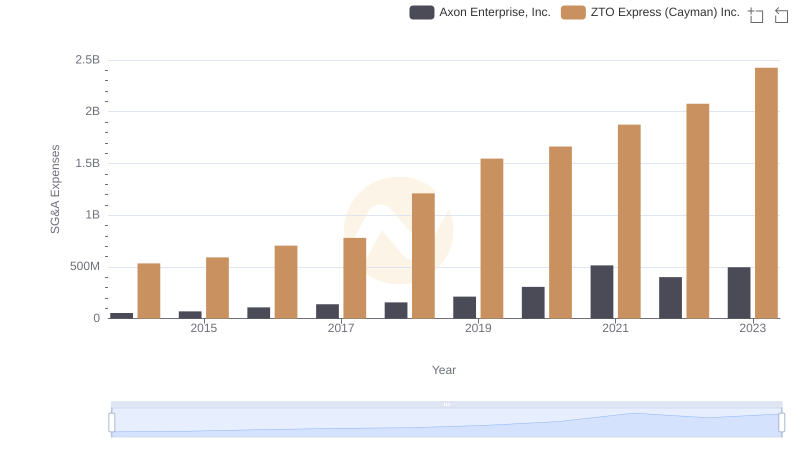
Axon Enterprise, Inc. or ZTO Express (Cayman) Inc.: Who Manages SG&A Costs Better?