| __timestamp | AMETEK, Inc. | CNH Industrial N.V. |
|---|---|---|
| Wednesday, January 1, 2014 | 4021964000 | 32555000000 |
| Thursday, January 1, 2015 | 3974295000 | 25912000000 |
| Friday, January 1, 2016 | 3840087000 | 24872000000 |
| Sunday, January 1, 2017 | 4300170000 | 27361000000 |
| Monday, January 1, 2018 | 4845872000 | 29706000000 |
| Tuesday, January 1, 2019 | 5158557000 | 28079000000 |
| Wednesday, January 1, 2020 | 4540029000 | 26032000000 |
| Friday, January 1, 2021 | 5546514000 | 33428000000 |
| Saturday, January 1, 2022 | 6150530000 | 23551000000 |
| Sunday, January 1, 2023 | 6596950000 | 24694000000 |
| Monday, January 1, 2024 | 6941180000 |
Unveiling the hidden dimensions of data
In the ever-evolving landscape of industrial manufacturing, AMETEK, Inc. and CNH Industrial N.V. stand as titans, each carving a unique path over the past decade. From 2014 to 2023, AMETEK's revenue journey reflects a robust growth trajectory, with a remarkable 64% increase, peaking at approximately $6.6 billion in 2023. This growth underscores AMETEK's strategic prowess in navigating market challenges and capitalizing on opportunities.
Conversely, CNH Industrial N.V. experienced a more volatile revenue pattern, with a notable dip in 2022 to around $23.6 billion, before a slight recovery in 2023. Despite these fluctuations, CNH's revenue remains significantly higher than AMETEK's, highlighting its expansive market reach.
This comparative analysis not only showcases the resilience and adaptability of these industrial giants but also offers valuable insights into the broader economic trends influencing the sector.
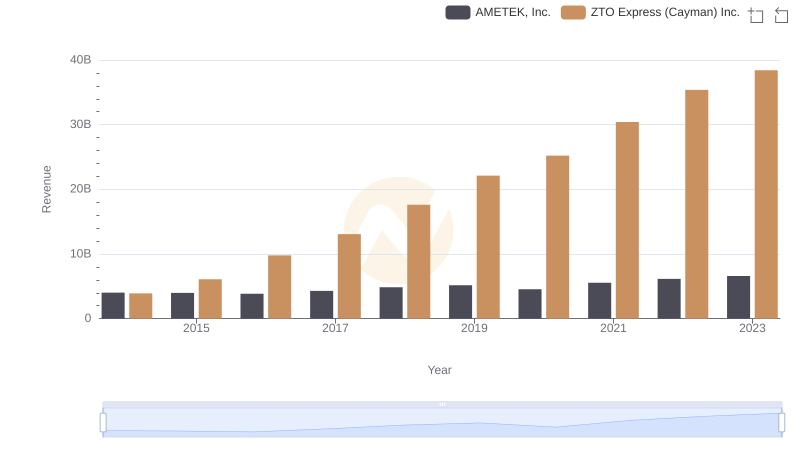
AMETEK, Inc. and ZTO Express (Cayman) Inc.: A Comprehensive Revenue Analysis
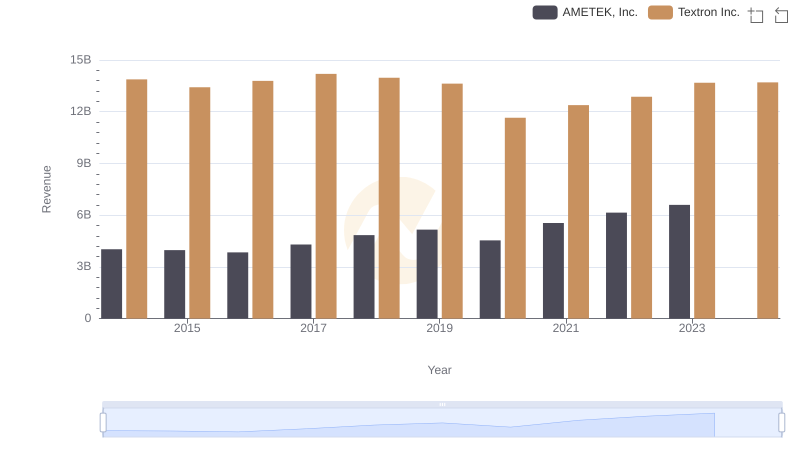
Breaking Down Revenue Trends: AMETEK, Inc. vs Textron Inc.
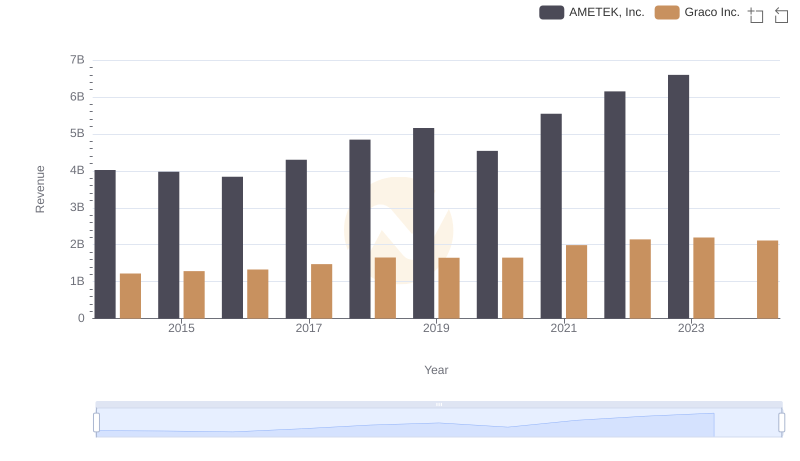
Annual Revenue Comparison: AMETEK, Inc. vs Graco Inc.
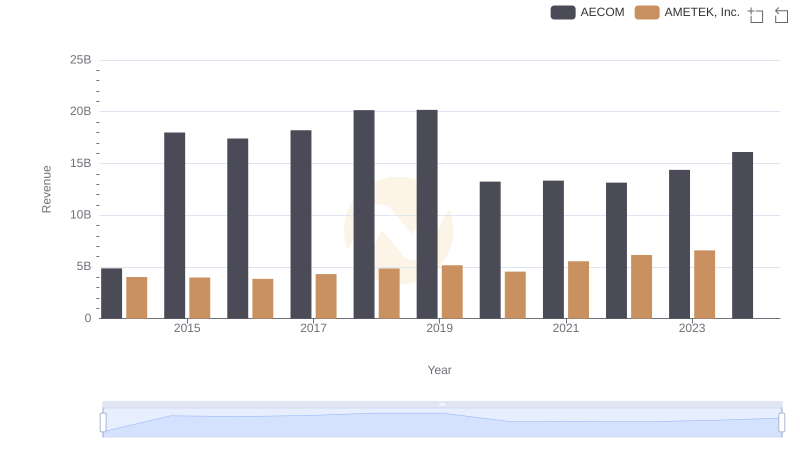
Who Generates More Revenue? AMETEK, Inc. or AECOM
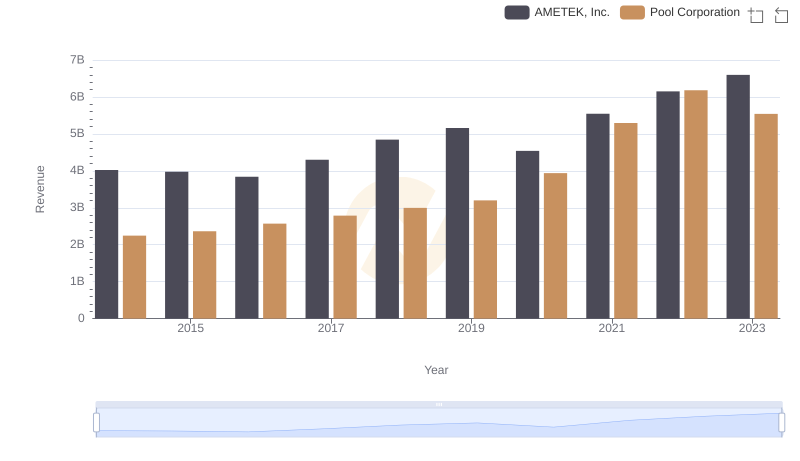
AMETEK, Inc. vs Pool Corporation: Annual Revenue Growth Compared
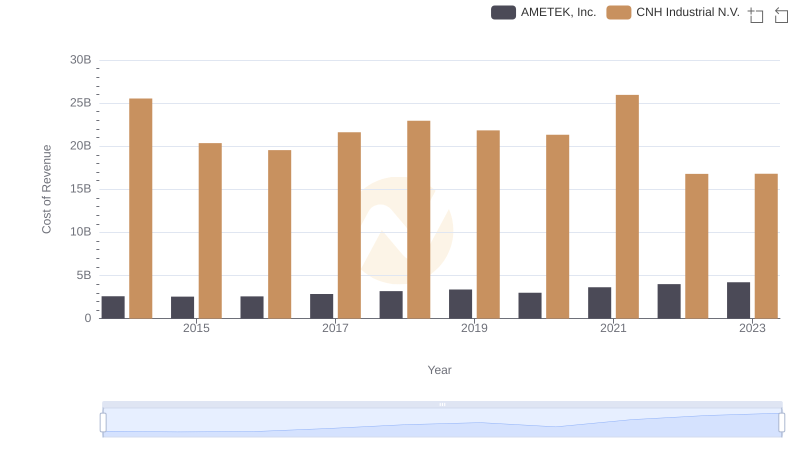
Cost Insights: Breaking Down AMETEK, Inc. and CNH Industrial N.V.'s Expenses
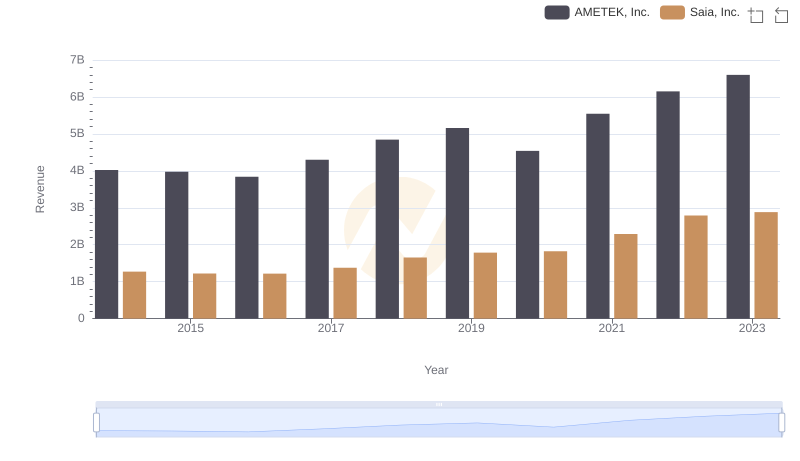
Revenue Showdown: AMETEK, Inc. vs Saia, Inc.
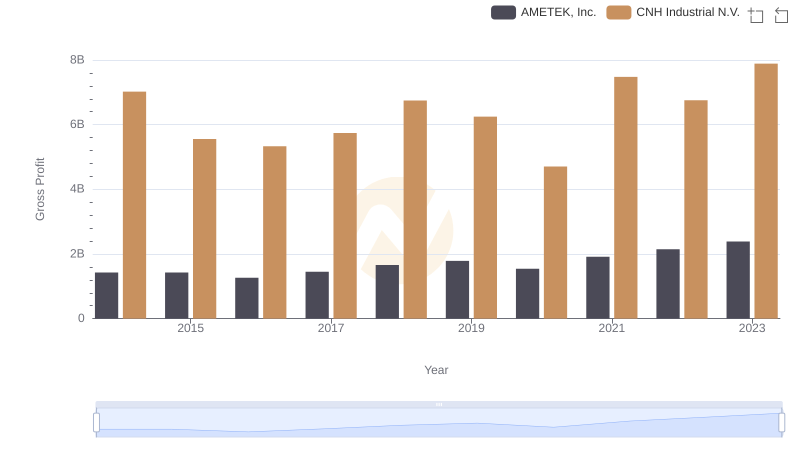
Gross Profit Trends Compared: AMETEK, Inc. vs CNH Industrial N.V.
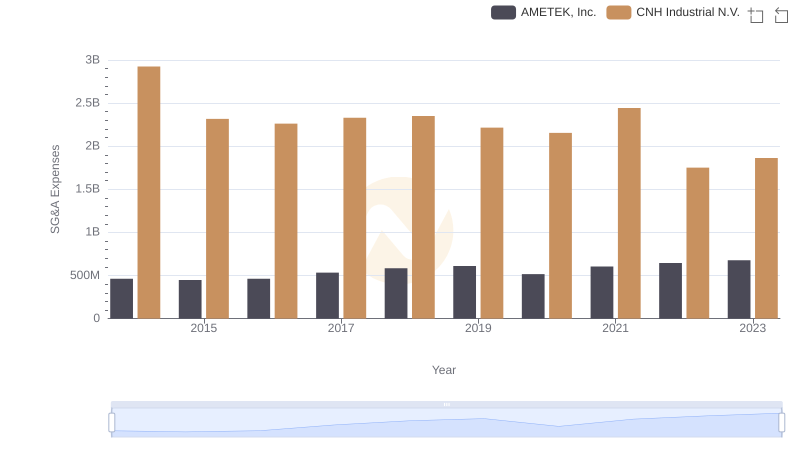
Who Optimizes SG&A Costs Better? AMETEK, Inc. or CNH Industrial N.V.