| __timestamp | AMETEK, Inc. | CNH Industrial N.V. |
|---|---|---|
| Wednesday, January 1, 2014 | 1424947000 | 7021000000 |
| Thursday, January 1, 2015 | 1425015000 | 5555000000 |
| Friday, January 1, 2016 | 1264867000 | 5333000000 |
| Sunday, January 1, 2017 | 1448739000 | 5740000000 |
| Monday, January 1, 2018 | 1659562000 | 6748000000 |
| Tuesday, January 1, 2019 | 1787660000 | 6247000000 |
| Wednesday, January 1, 2020 | 1543514000 | 4705000000 |
| Friday, January 1, 2021 | 1912614000 | 7477000000 |
| Saturday, January 1, 2022 | 2145269000 | 6754000000 |
| Sunday, January 1, 2023 | 2384465001 | 7889000000 |
| Monday, January 1, 2024 | 6941180000 |
Data in motion
In the ever-evolving landscape of industrial manufacturing, AMETEK, Inc. and CNH Industrial N.V. have emerged as formidable players. Over the past decade, these companies have showcased distinct trajectories in their gross profit trends. From 2014 to 2023, AMETEK, Inc. has seen a remarkable growth of approximately 67%, with its gross profit rising from around $1.42 billion to $2.38 billion. This steady climb underscores AMETEK's strategic prowess in navigating market challenges.
Conversely, CNH Industrial N.V. experienced a more volatile journey. Despite a dip in 2015 and 2020, CNH's gross profit rebounded impressively, culminating in a 12% increase from 2014 to 2023. This resilience highlights CNH's adaptability in a competitive market. As we delve into these trends, it becomes evident that both companies, though on different paths, continue to shape the industrial sector's future.
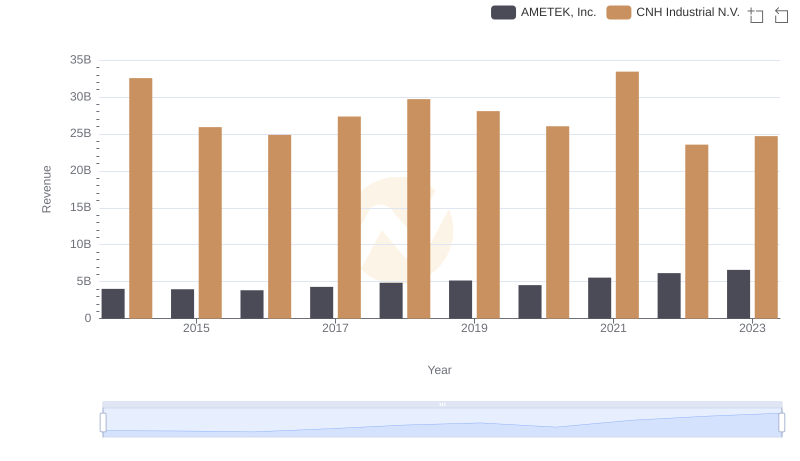
AMETEK, Inc. and CNH Industrial N.V.: A Comprehensive Revenue Analysis
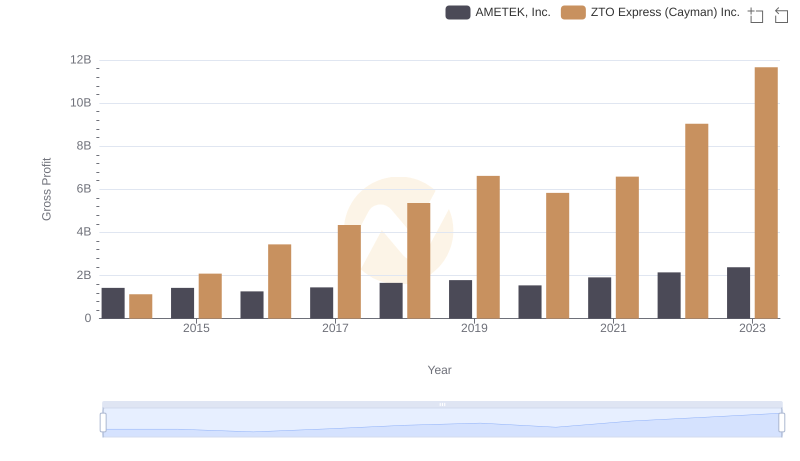
Gross Profit Comparison: AMETEK, Inc. and ZTO Express (Cayman) Inc. Trends
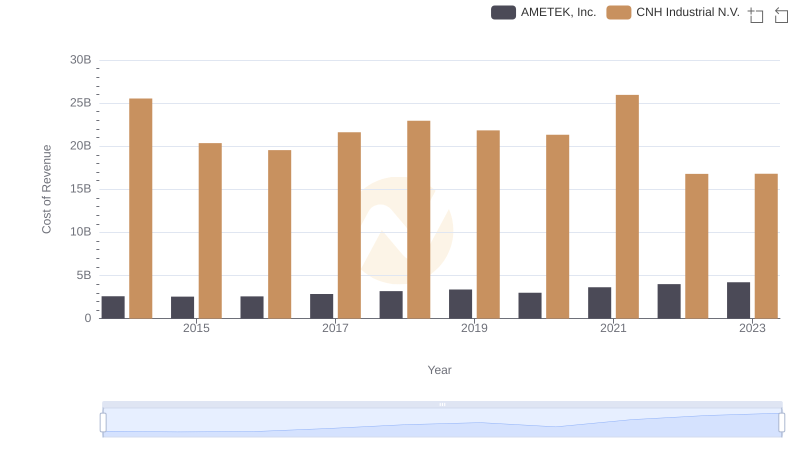
Cost Insights: Breaking Down AMETEK, Inc. and CNH Industrial N.V.'s Expenses
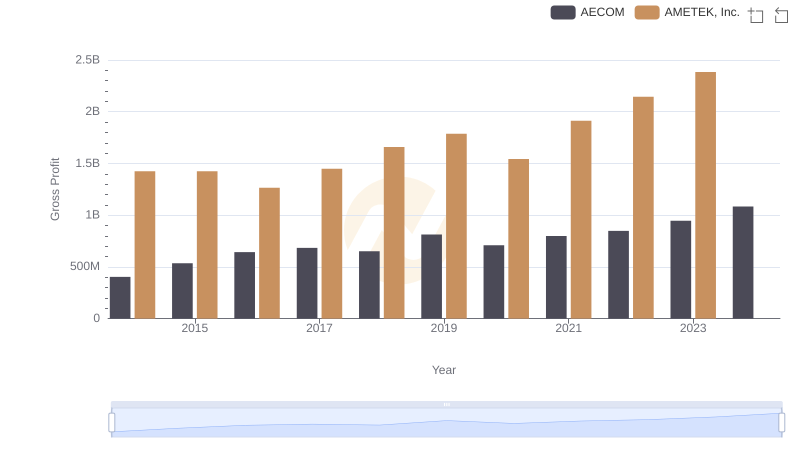
Gross Profit Trends Compared: AMETEK, Inc. vs AECOM
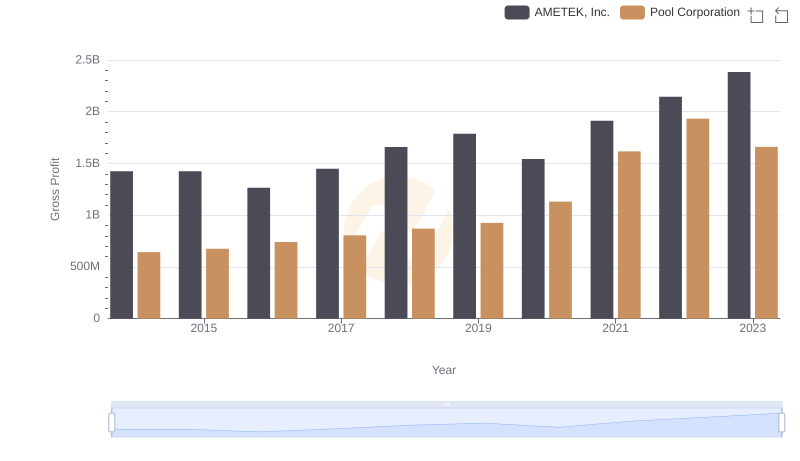
AMETEK, Inc. vs Pool Corporation: A Gross Profit Performance Breakdown
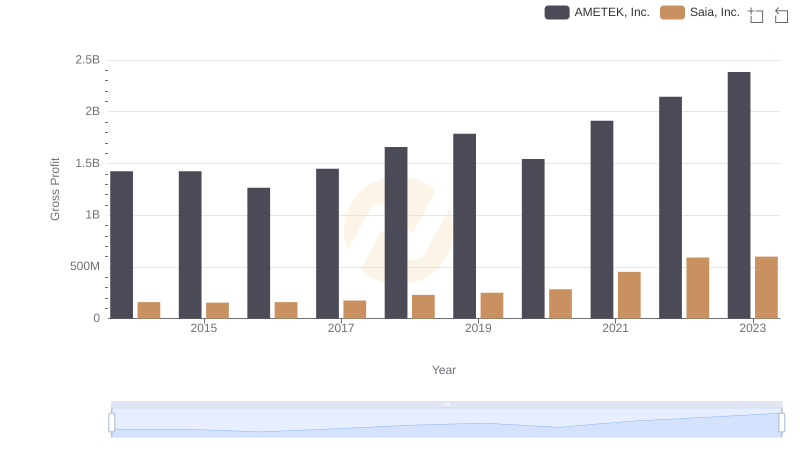
Gross Profit Trends Compared: AMETEK, Inc. vs Saia, Inc.
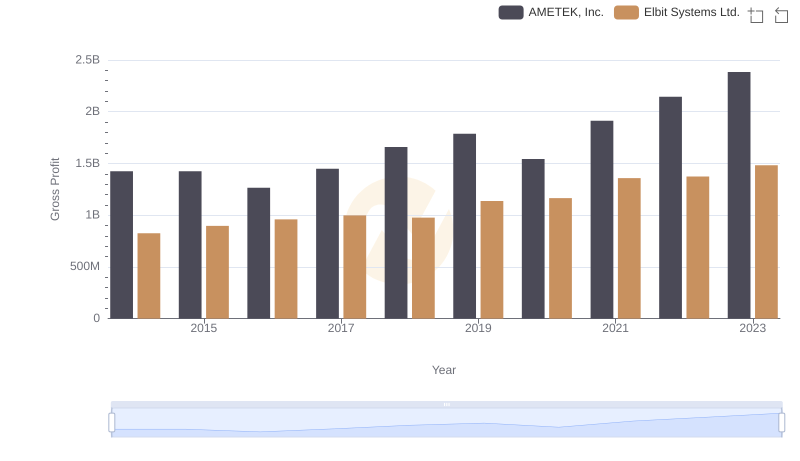
Key Insights on Gross Profit: AMETEK, Inc. vs Elbit Systems Ltd.
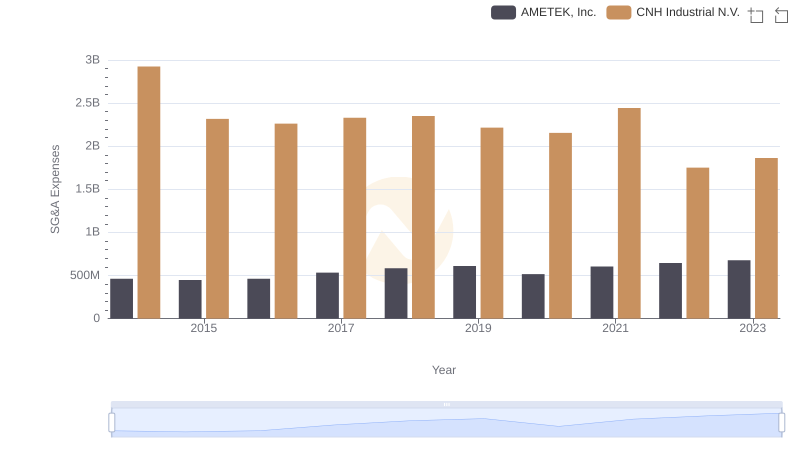
Who Optimizes SG&A Costs Better? AMETEK, Inc. or CNH Industrial N.V.