| __timestamp | PACCAR Inc | Waste Management, Inc. |
|---|---|---|
| Wednesday, January 1, 2014 | 561400000 | 1481000000 |
| Thursday, January 1, 2015 | 541500000 | 1343000000 |
| Friday, January 1, 2016 | 540200000 | 1410000000 |
| Sunday, January 1, 2017 | 555000000 | 1468000000 |
| Monday, January 1, 2018 | 644700000 | 1453000000 |
| Tuesday, January 1, 2019 | 698500000 | 1631000000 |
| Wednesday, January 1, 2020 | 581400000 | 1728000000 |
| Friday, January 1, 2021 | 676800000 | 1864000000 |
| Saturday, January 1, 2022 | 726300000 | 1938000000 |
| Sunday, January 1, 2023 | 784600000 | 1926000000 |
| Monday, January 1, 2024 | 585000000 | 2264000000 |
In pursuit of knowledge
In the world of corporate finance, understanding the nuances of Selling, General, and Administrative (SG&A) expenses is crucial. Waste Management, Inc. and PACCAR Inc., two industry titans, have shown distinct spending patterns over the past decade. From 2014 to 2023, Waste Management's SG&A expenses surged by approximately 30%, peaking in 2022. In contrast, PACCAR's expenses grew by about 40%, reaching their zenith in 2023. This divergence highlights Waste Management's consistent investment in administrative efficiency, while PACCAR's fluctuating expenses suggest strategic shifts in operational focus. Notably, 2024 data for Waste Management is missing, leaving room for speculation on future trends. As businesses navigate the complexities of SG&A management, these insights offer a window into the strategic priorities of two leading corporations.
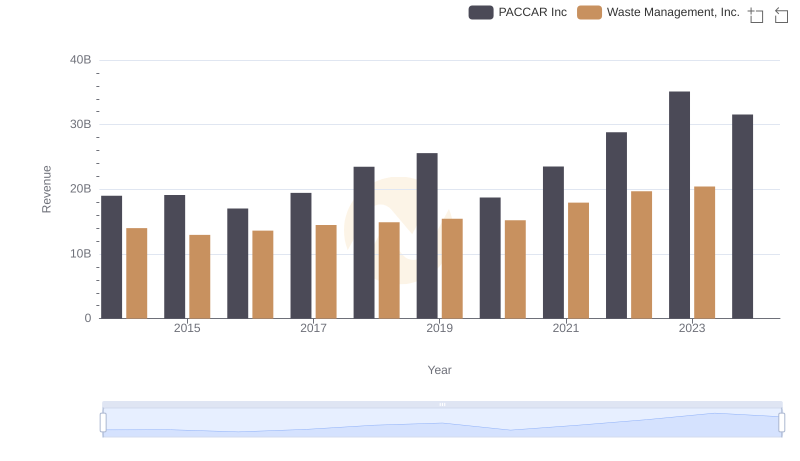
Waste Management, Inc. vs PACCAR Inc: Examining Key Revenue Metrics
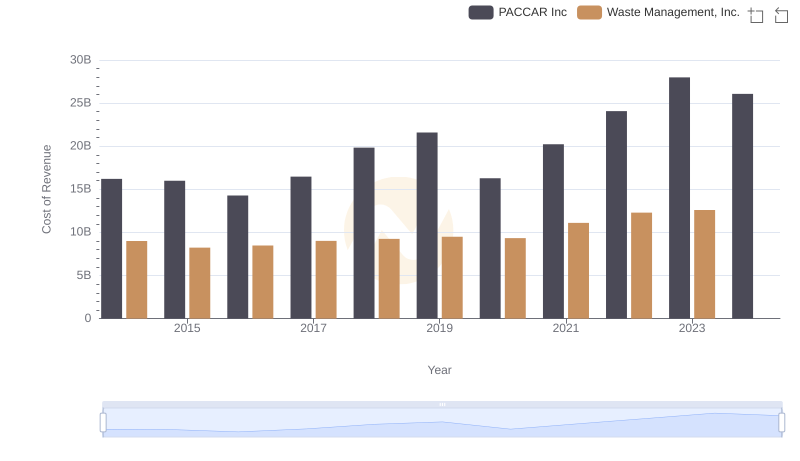
Waste Management, Inc. vs PACCAR Inc: Efficiency in Cost of Revenue Explored
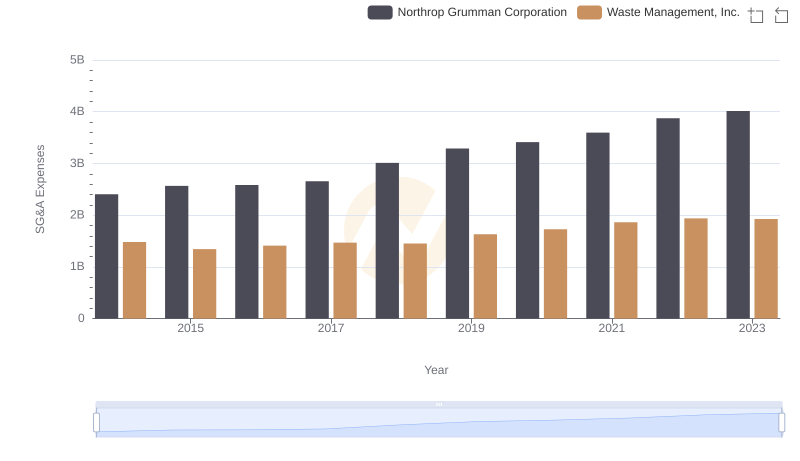
Waste Management, Inc. vs Northrop Grumman Corporation: SG&A Expense Trends

Breaking Down SG&A Expenses: Waste Management, Inc. vs Republic Services, Inc.
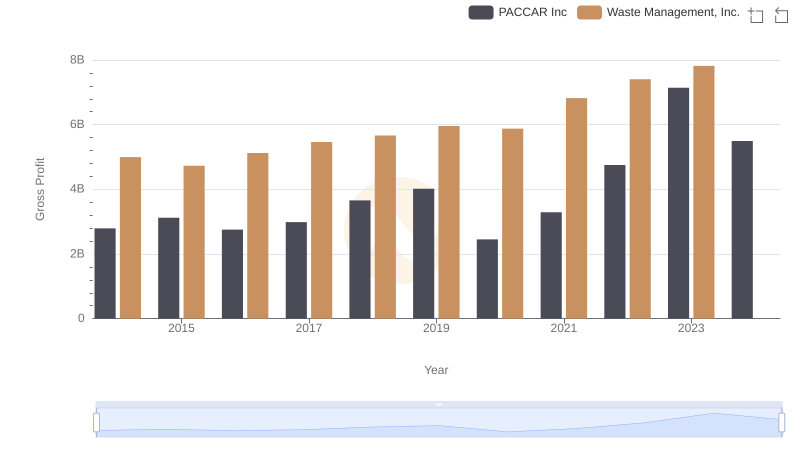
Key Insights on Gross Profit: Waste Management, Inc. vs PACCAR Inc
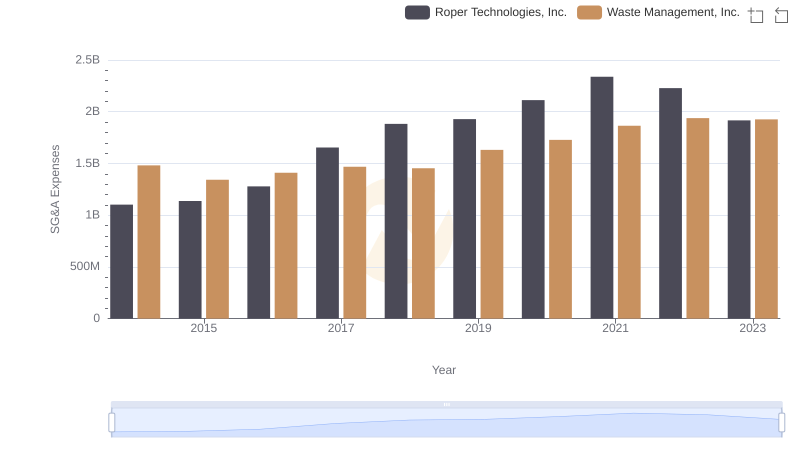
Who Optimizes SG&A Costs Better? Waste Management, Inc. or Roper Technologies, Inc.
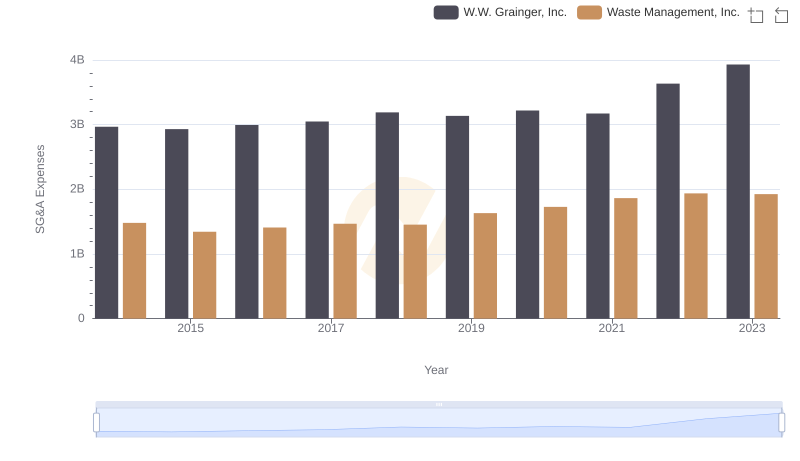
Waste Management, Inc. and W.W. Grainger, Inc.: SG&A Spending Patterns Compared
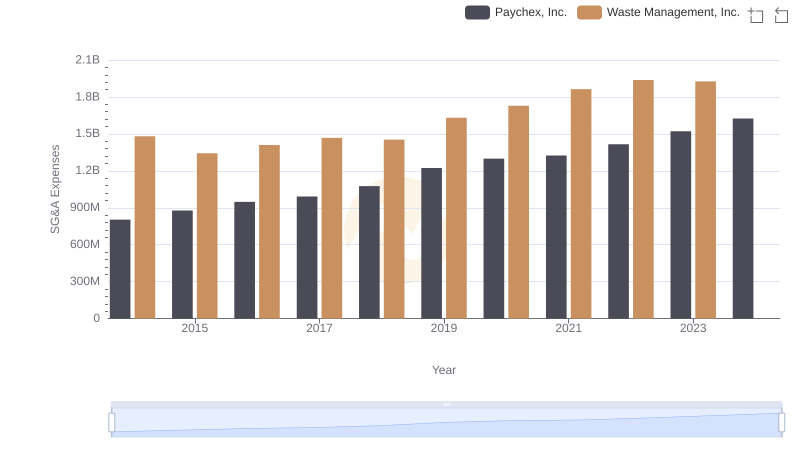
Waste Management, Inc. or Paychex, Inc.: Who Manages SG&A Costs Better?
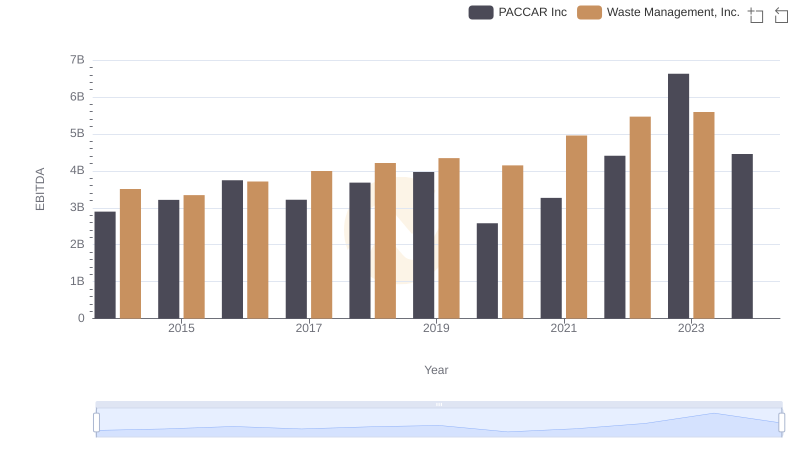
Comprehensive EBITDA Comparison: Waste Management, Inc. vs PACCAR Inc
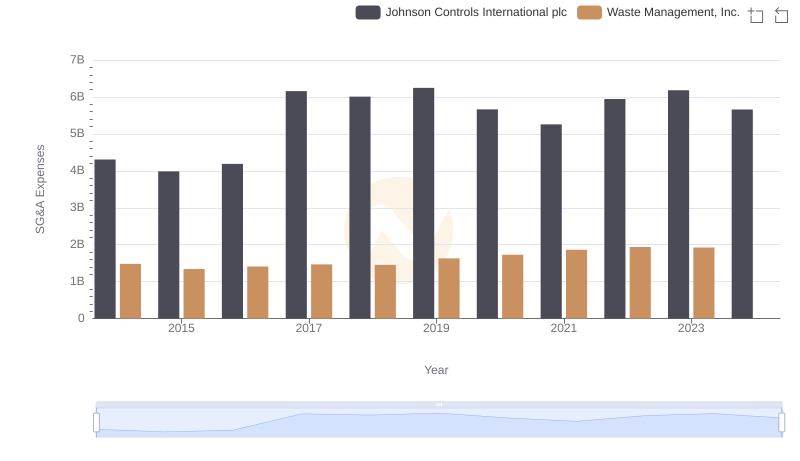
Waste Management, Inc. and Johnson Controls International plc: SG&A Spending Patterns Compared
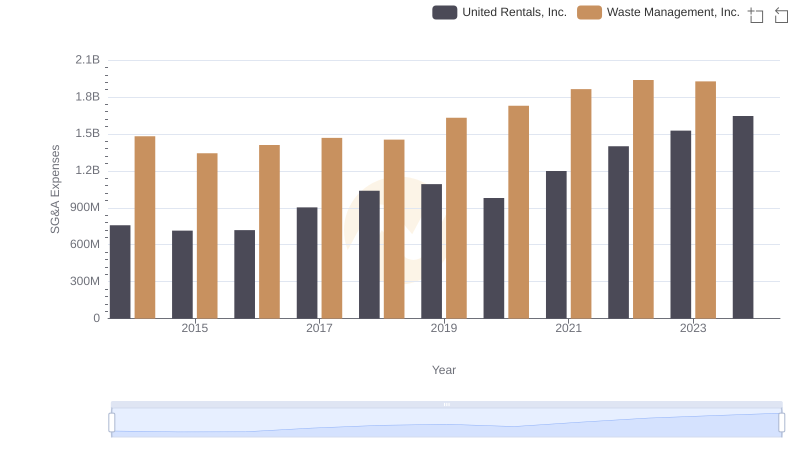
Selling, General, and Administrative Costs: Waste Management, Inc. vs United Rentals, Inc.