| __timestamp | Waste Connections, Inc. | Xylem Inc. |
|---|---|---|
| Wednesday, January 1, 2014 | 940778000 | 1513000000 |
| Thursday, January 1, 2015 | 939878000 | 1404000000 |
| Friday, January 1, 2016 | 1418151000 | 1461000000 |
| Sunday, January 1, 2017 | 1925713000 | 1851000000 |
| Monday, January 1, 2018 | 2057237000 | 2026000000 |
| Tuesday, January 1, 2019 | 2189922000 | 2046000000 |
| Wednesday, January 1, 2020 | 2169182000 | 1830000000 |
| Friday, January 1, 2021 | 2497287000 | 1975000000 |
| Saturday, January 1, 2022 | 2875847000 | 2084000000 |
| Sunday, January 1, 2023 | 3277438000 | 2717000000 |
| Monday, January 1, 2024 | 3727885000 |
In pursuit of knowledge
In the ever-evolving landscape of industrial services, Waste Connections, Inc. and Xylem Inc. have emerged as formidable players. Over the past decade, from 2014 to 2023, these companies have demonstrated remarkable growth in gross profit, reflecting their strategic prowess and market adaptability.
Waste Connections, Inc. has seen its gross profit soar by approximately 248%, starting from a modest $940 million in 2014 to an impressive $3.28 billion in 2023. This growth underscores the company's robust expansion and operational efficiency.
Meanwhile, Xylem Inc. has also shown significant progress, with its gross profit increasing by about 80% over the same period, from $1.51 billion to $2.72 billion. This steady rise highlights Xylem's commitment to innovation and sustainability in water technology.
As these industry giants continue to evolve, their financial trajectories offer valuable insights into the dynamics of the industrial sector.
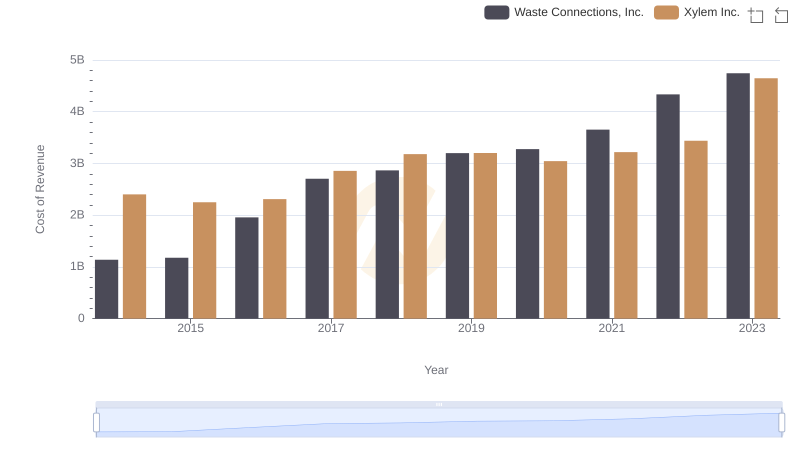
Cost of Revenue: Key Insights for Waste Connections, Inc. and Xylem Inc.

Waste Connections, Inc. vs Ferrovial SE: A Gross Profit Performance Breakdown
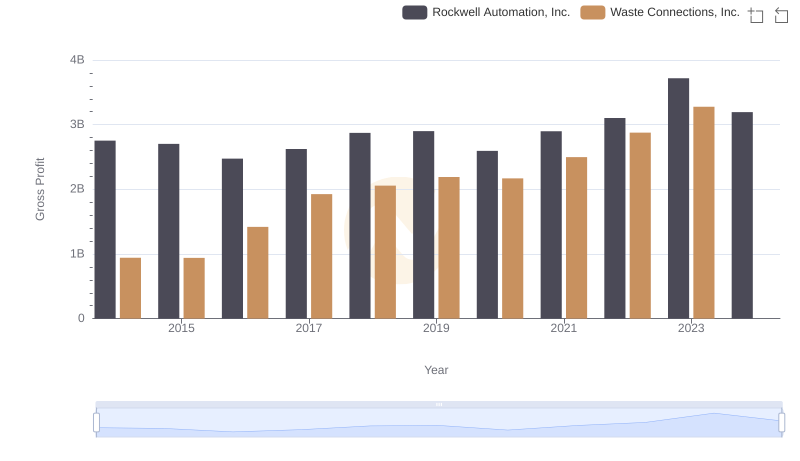
Waste Connections, Inc. and Rockwell Automation, Inc.: A Detailed Gross Profit Analysis
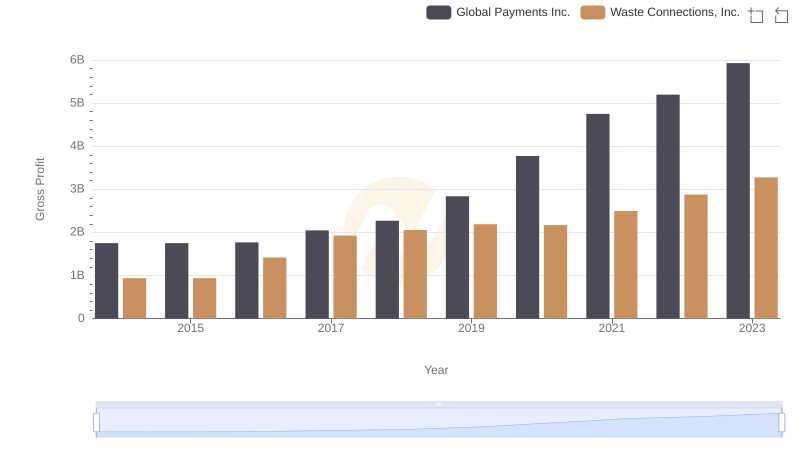
Gross Profit Trends Compared: Waste Connections, Inc. vs Global Payments Inc.
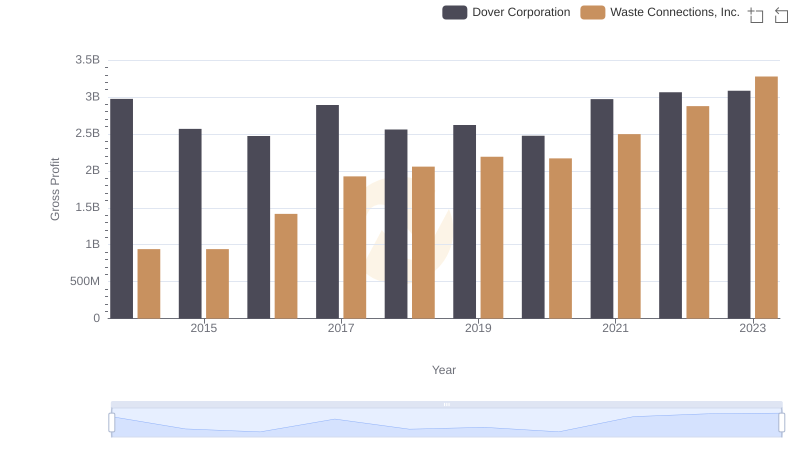
Waste Connections, Inc. and Dover Corporation: A Detailed Gross Profit Analysis
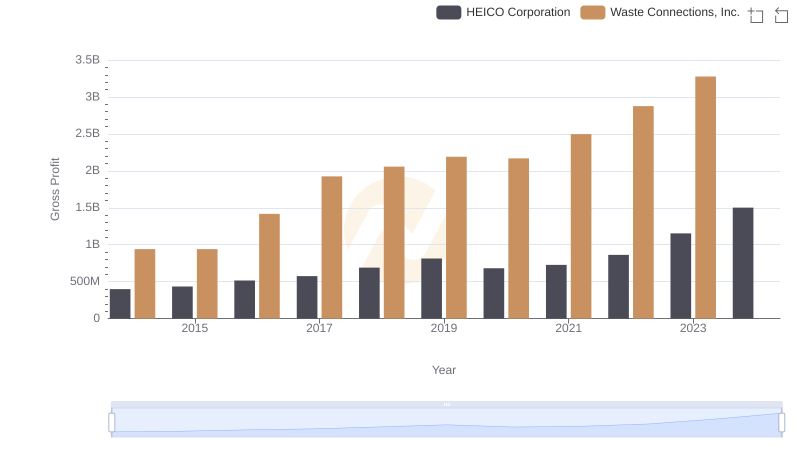
Gross Profit Analysis: Comparing Waste Connections, Inc. and HEICO Corporation
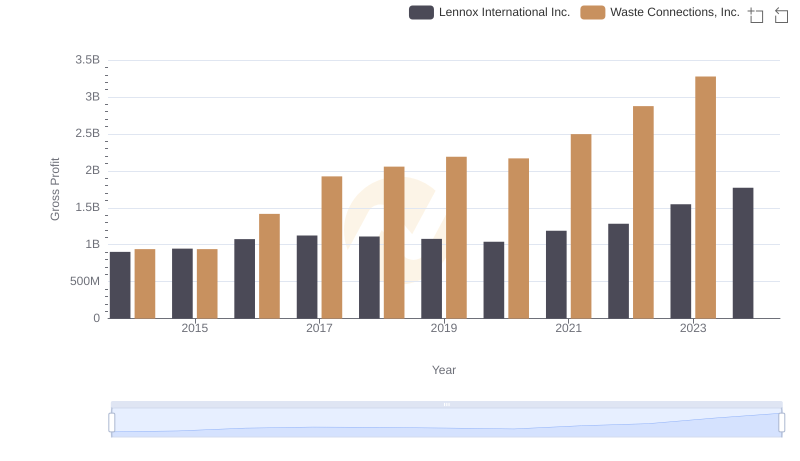
Who Generates Higher Gross Profit? Waste Connections, Inc. or Lennox International Inc.
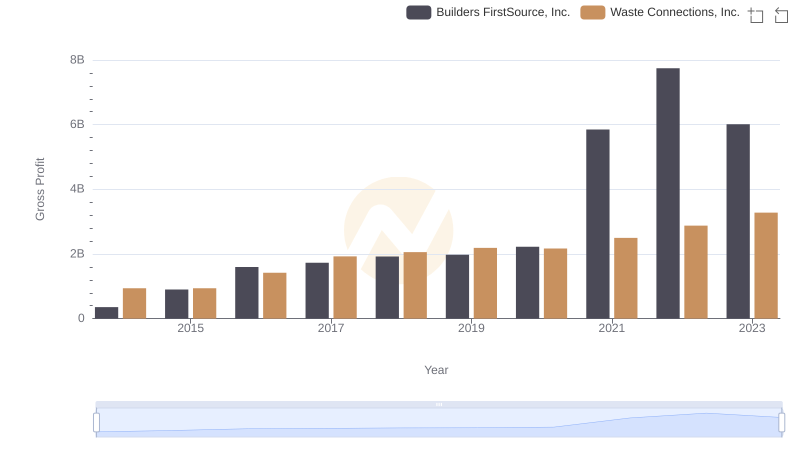
Key Insights on Gross Profit: Waste Connections, Inc. vs Builders FirstSource, Inc.
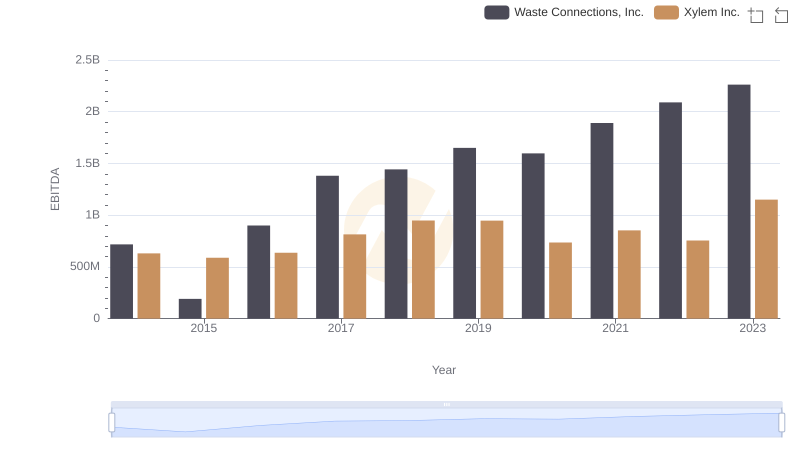
Comprehensive EBITDA Comparison: Waste Connections, Inc. vs Xylem Inc.