| __timestamp | Intuit Inc. | Manhattan Associates, Inc. |
|---|---|---|
| Wednesday, January 1, 2014 | 4506000000 | 492104000 |
| Thursday, January 1, 2015 | 4192000000 | 556371000 |
| Friday, January 1, 2016 | 4694000000 | 604557000 |
| Sunday, January 1, 2017 | 5177000000 | 594599000 |
| Monday, January 1, 2018 | 5964000000 | 559157000 |
| Tuesday, January 1, 2019 | 6784000000 | 617949000 |
| Wednesday, January 1, 2020 | 7679000000 | 586372000 |
| Friday, January 1, 2021 | 9633000000 | 663643000 |
| Saturday, January 1, 2022 | 12726000000 | 767084000 |
| Sunday, January 1, 2023 | 14368000000 | 928725000 |
| Monday, January 1, 2024 | 16285000000 | 1042352000 |
In pursuit of knowledge
In the ever-evolving landscape of financial technology and supply chain solutions, Intuit Inc. and Manhattan Associates, Inc. have demonstrated remarkable growth over the past decade. Since 2014, Intuit's revenue has surged by approximately 261%, reflecting its robust expansion in the financial software sector. In contrast, Manhattan Associates, specializing in supply chain and inventory management, has seen a steady increase of around 112% in the same period.
This comparison highlights the dynamic nature of these industries and the strategic maneuvers that have propelled these companies to new heights.
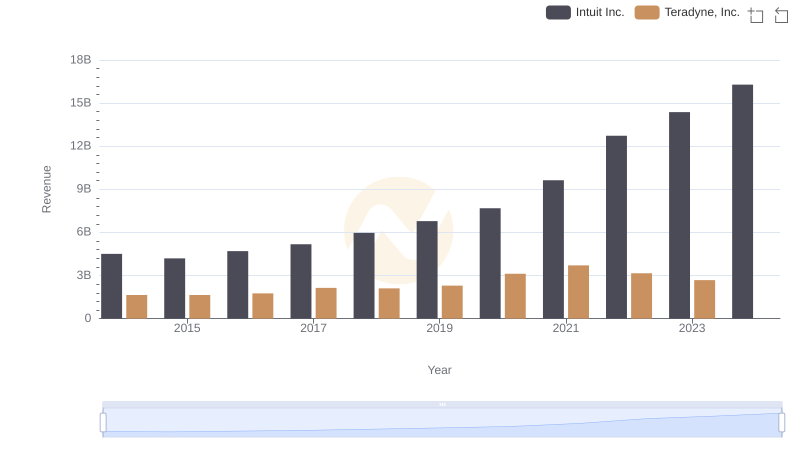
Annual Revenue Comparison: Intuit Inc. vs Teradyne, Inc.
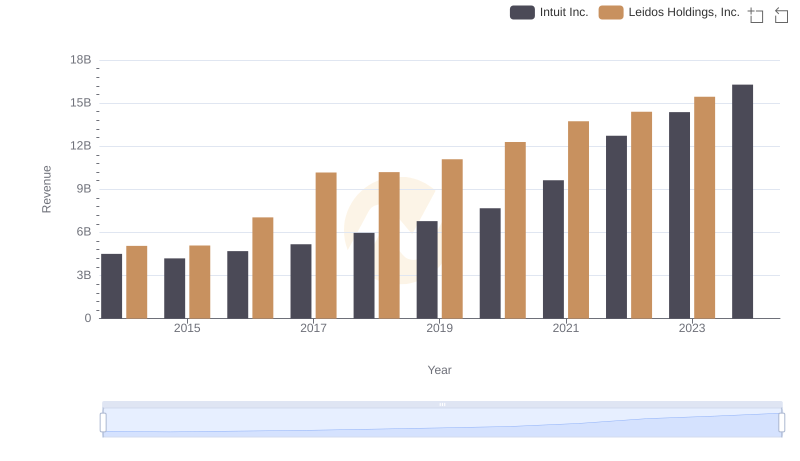
Intuit Inc. vs Leidos Holdings, Inc.: Examining Key Revenue Metrics
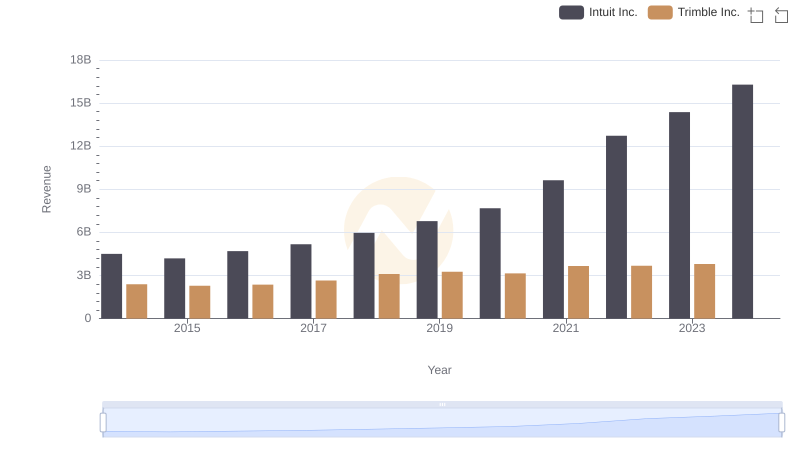
Breaking Down Revenue Trends: Intuit Inc. vs Trimble Inc.
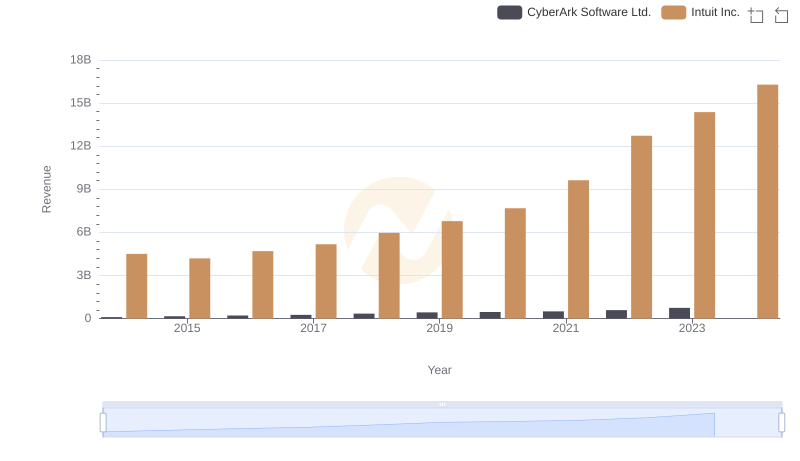
Who Generates More Revenue? Intuit Inc. or CyberArk Software Ltd.
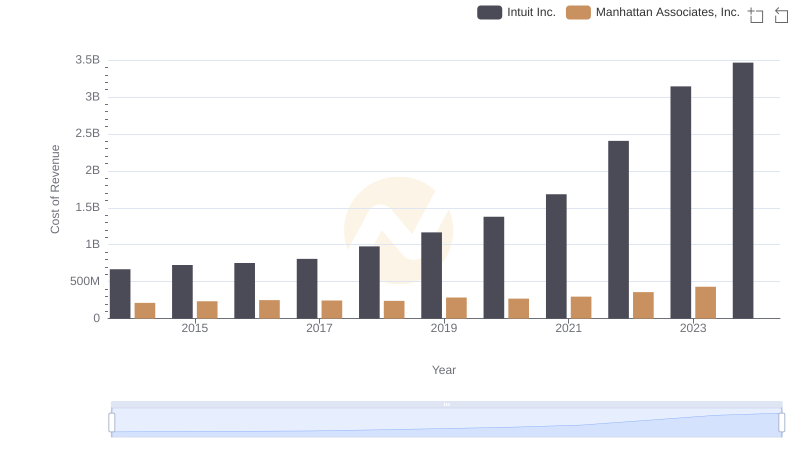
Analyzing Cost of Revenue: Intuit Inc. and Manhattan Associates, Inc.
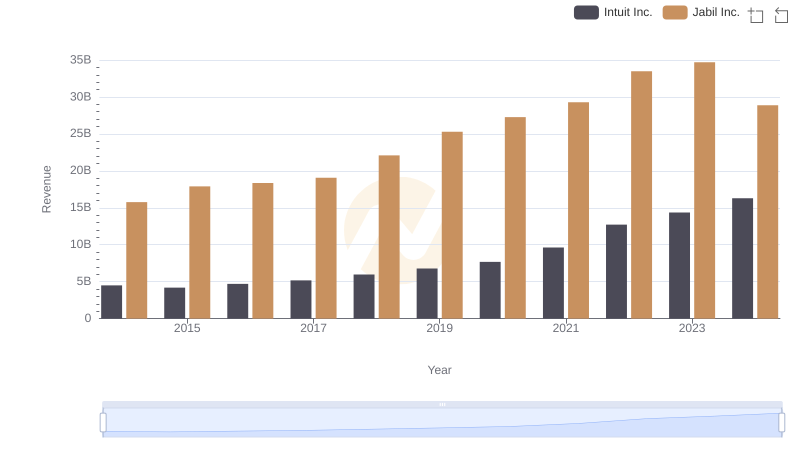
Intuit Inc. and Jabil Inc.: A Comprehensive Revenue Analysis
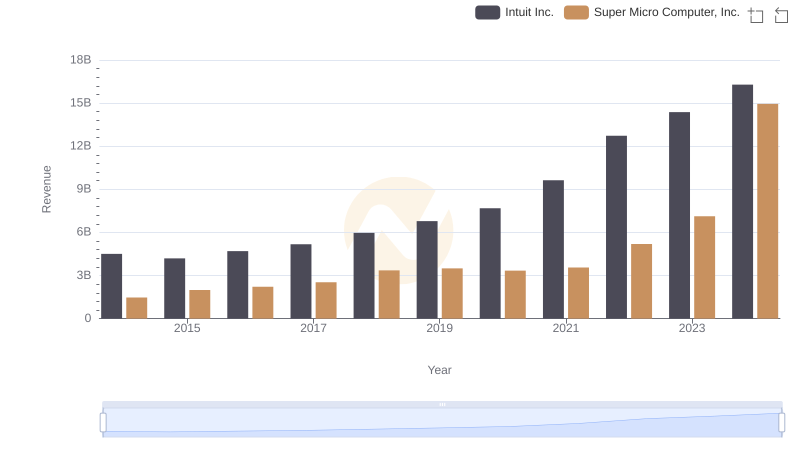
Breaking Down Revenue Trends: Intuit Inc. vs Super Micro Computer, Inc.
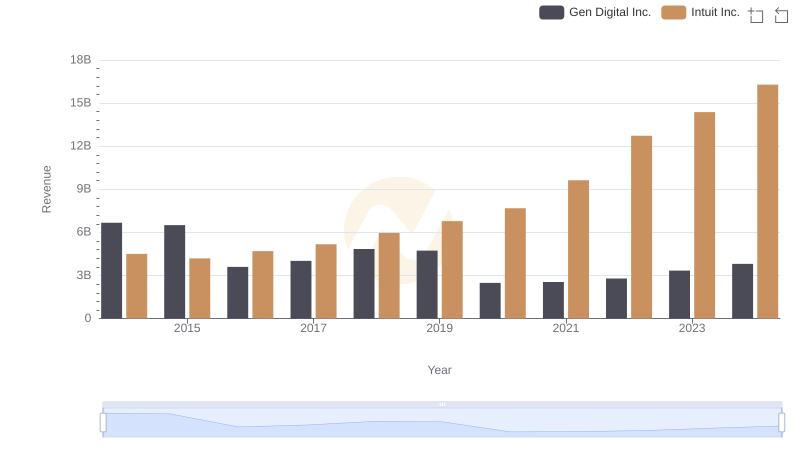
Intuit Inc. or Gen Digital Inc.: Who Leads in Yearly Revenue?
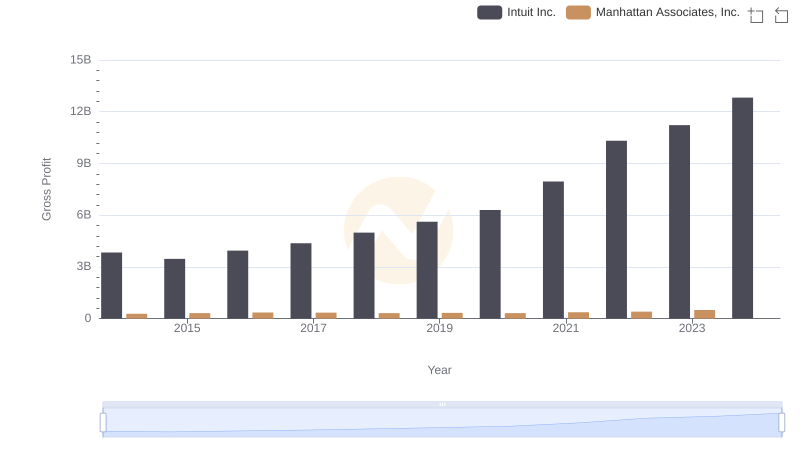
Gross Profit Trends Compared: Intuit Inc. vs Manhattan Associates, Inc.
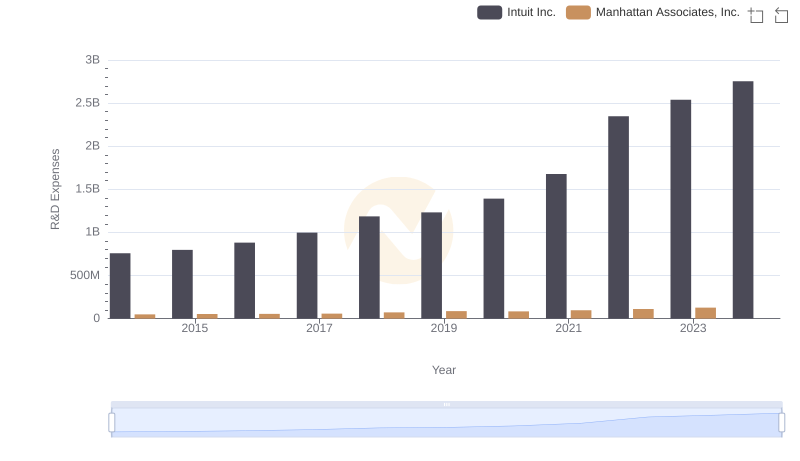
R&D Spending Showdown: Intuit Inc. vs Manhattan Associates, Inc.
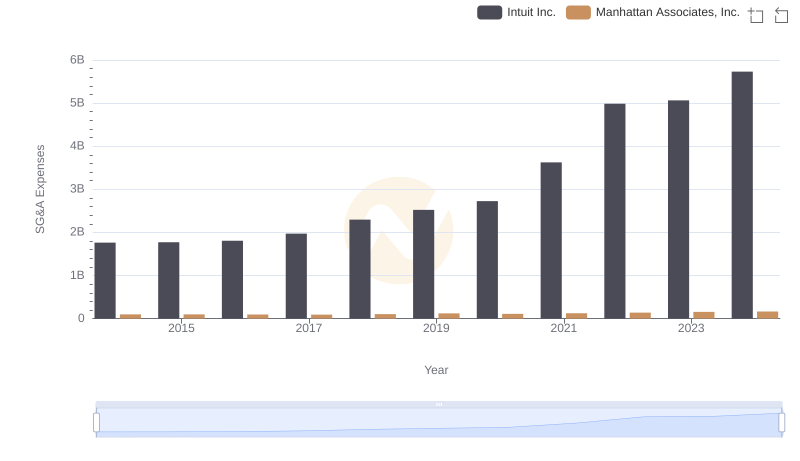
Intuit Inc. vs Manhattan Associates, Inc.: SG&A Expense Trends
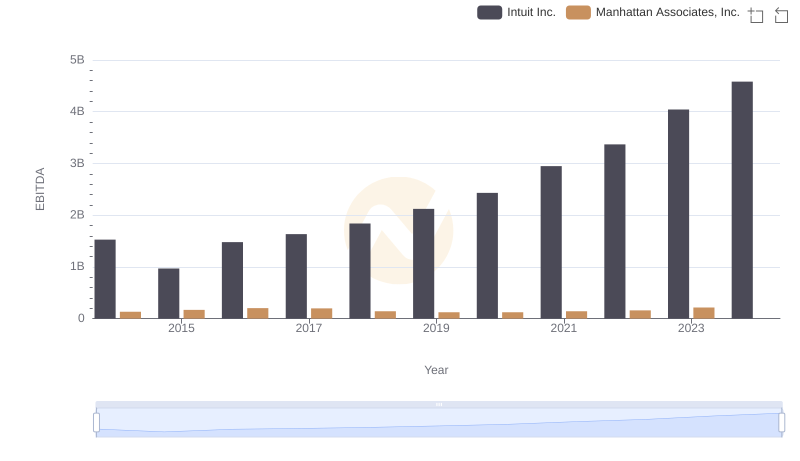
Comprehensive EBITDA Comparison: Intuit Inc. vs Manhattan Associates, Inc.