| __timestamp | Infosys Limited | Tyler Technologies, Inc. |
|---|---|---|
| Wednesday, January 1, 2014 | 5374000000 | 259730000 |
| Thursday, January 1, 2015 | 5950000000 | 313835000 |
| Friday, January 1, 2016 | 6446000000 | 400692000 |
| Sunday, January 1, 2017 | 7001000000 | 441522000 |
| Monday, January 1, 2018 | 7687000000 | 495704000 |
| Tuesday, January 1, 2019 | 8552000000 | 569527000 |
| Wednesday, January 1, 2020 | 8828000000 | 574151000 |
| Friday, January 1, 2021 | 10996000000 | 882643000 |
| Saturday, January 1, 2022 | 12709000000 | 1066341000 |
| Sunday, January 1, 2023 | 13096000000 | 1090652000 |
| Monday, January 1, 2024 | 1202042000 |
Infusing magic into the data realm
In the ever-evolving landscape of technology, understanding cost structures is crucial for investors and analysts alike. Over the past decade, Infosys Limited and Tyler Technologies, Inc. have demonstrated distinct trajectories in their cost of revenue. From 2014 to 2023, Infosys Limited's cost of revenue surged by approximately 144%, reflecting its expansive growth and operational scaling. In contrast, Tyler Technologies, Inc. experienced a more modest increase of around 320%, indicative of its strategic investments and market penetration.
These trends underscore the dynamic nature of the tech industry, where strategic cost management is pivotal for sustained growth.
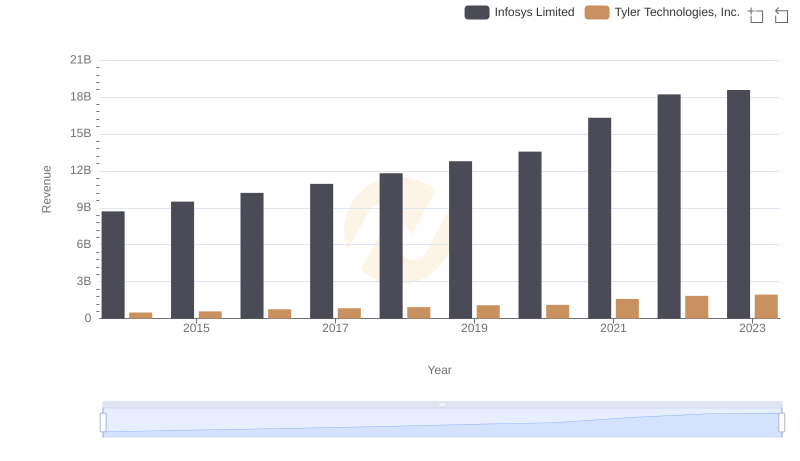
Annual Revenue Comparison: Infosys Limited vs Tyler Technologies, Inc.
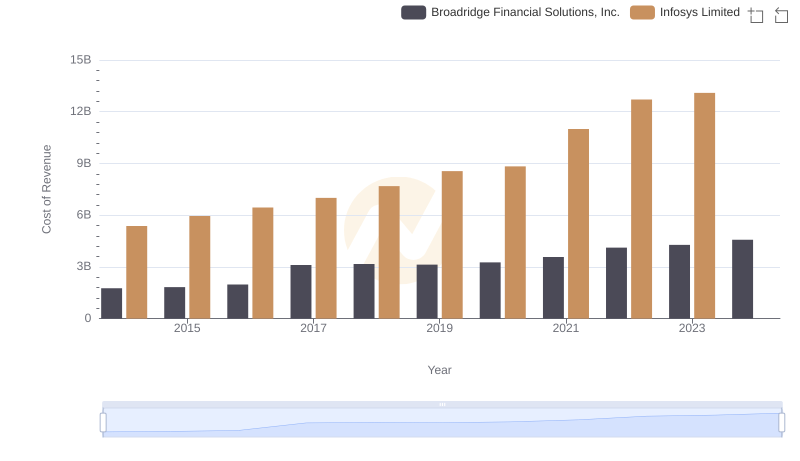
Comparing Cost of Revenue Efficiency: Infosys Limited vs Broadridge Financial Solutions, Inc.
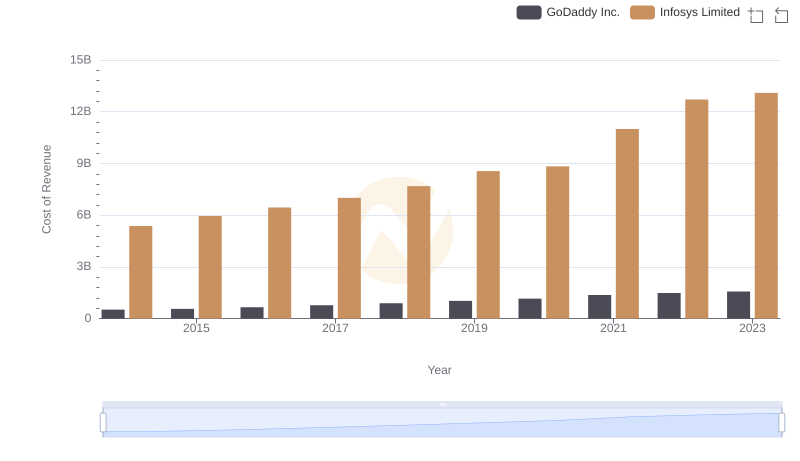
Cost of Revenue: Key Insights for Infosys Limited and GoDaddy Inc.
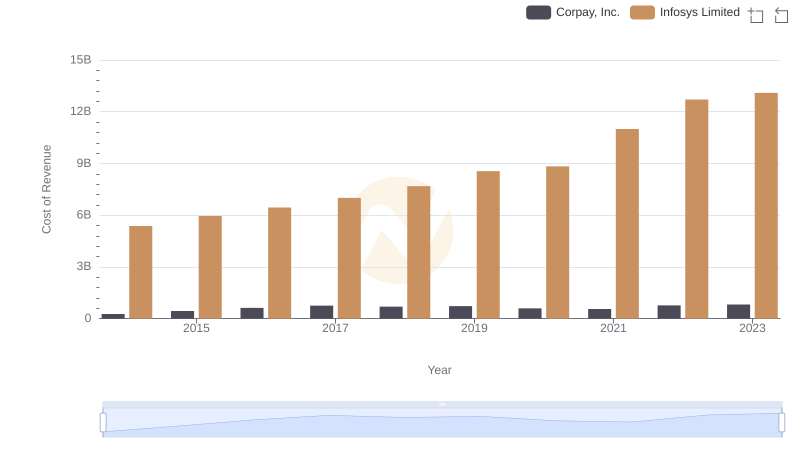
Analyzing Cost of Revenue: Infosys Limited and Corpay, Inc.
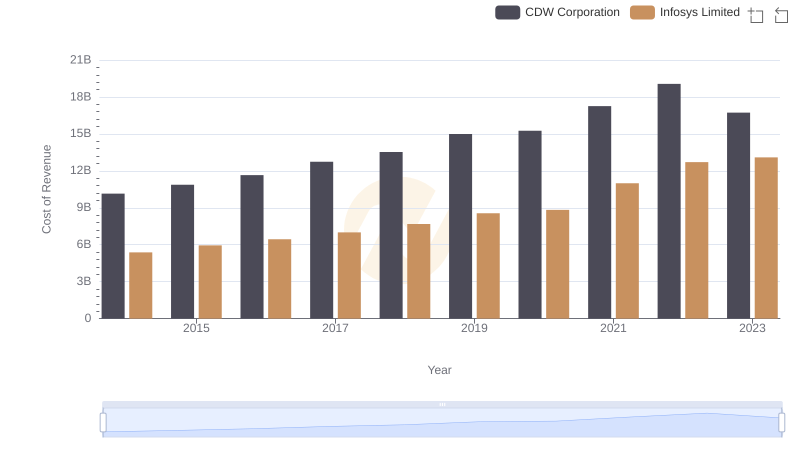
Cost of Revenue: Key Insights for Infosys Limited and CDW Corporation
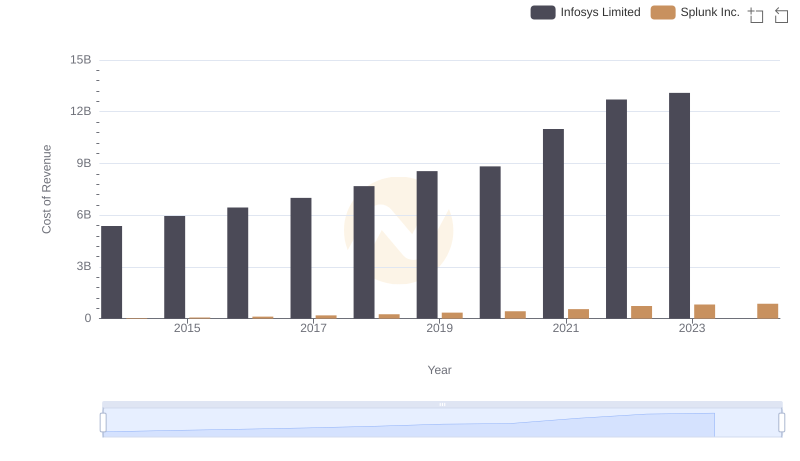
Infosys Limited vs Splunk Inc.: Efficiency in Cost of Revenue Explored
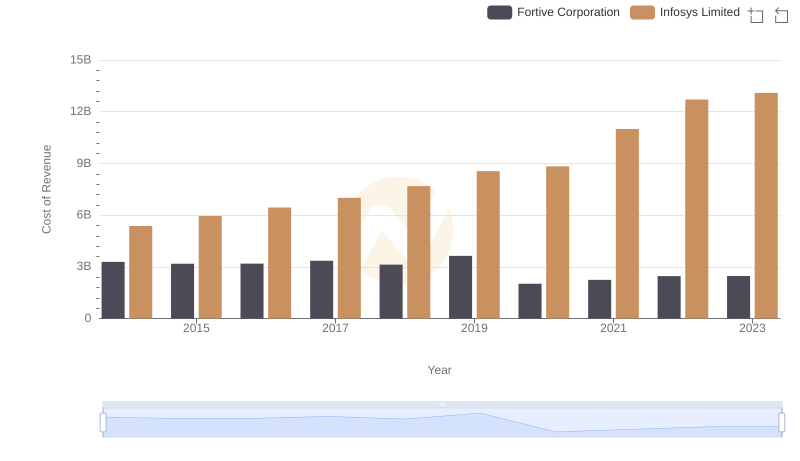
Comparing Cost of Revenue Efficiency: Infosys Limited vs Fortive Corporation
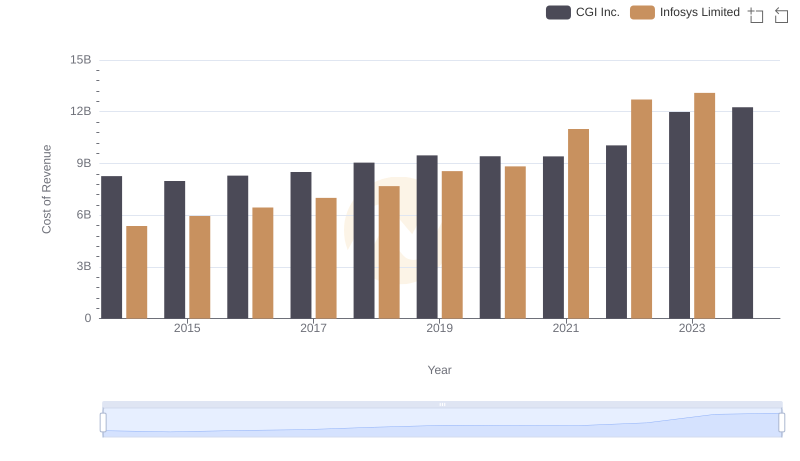
Analyzing Cost of Revenue: Infosys Limited and CGI Inc.
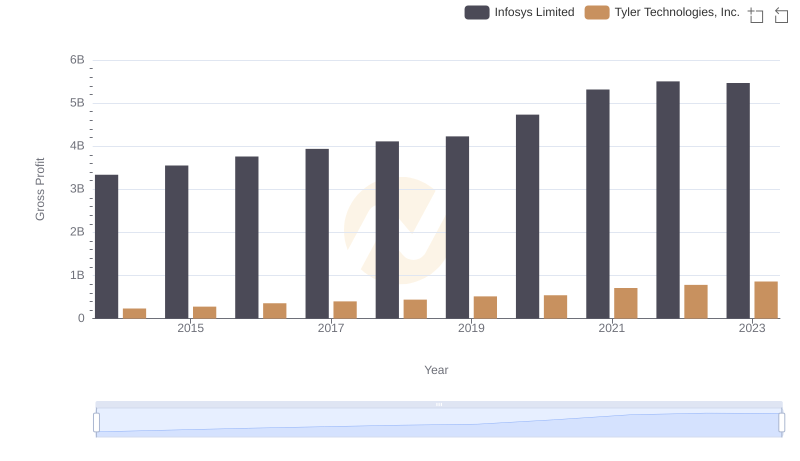
Gross Profit Trends Compared: Infosys Limited vs Tyler Technologies, Inc.
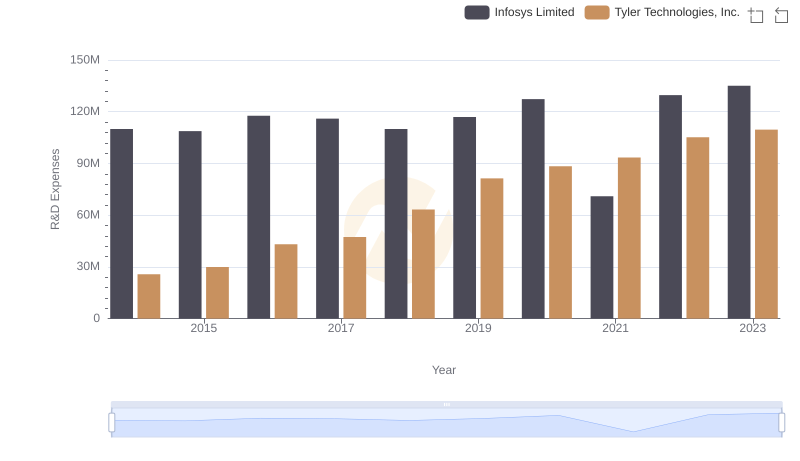
Research and Development: Comparing Key Metrics for Infosys Limited and Tyler Technologies, Inc.
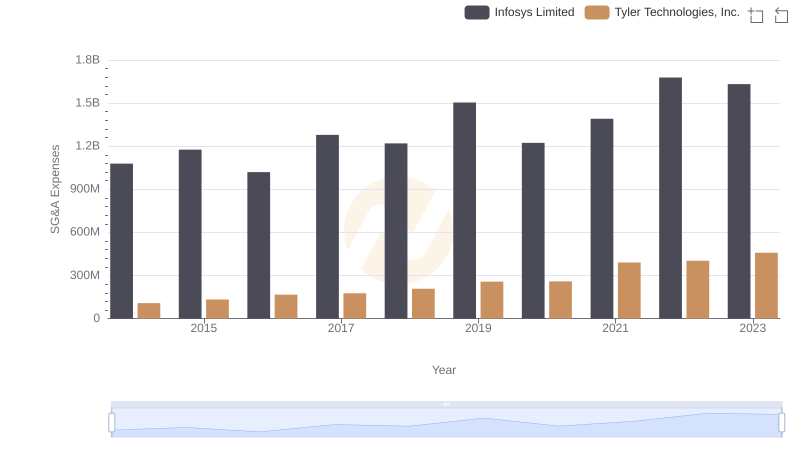
Selling, General, and Administrative Costs: Infosys Limited vs Tyler Technologies, Inc.
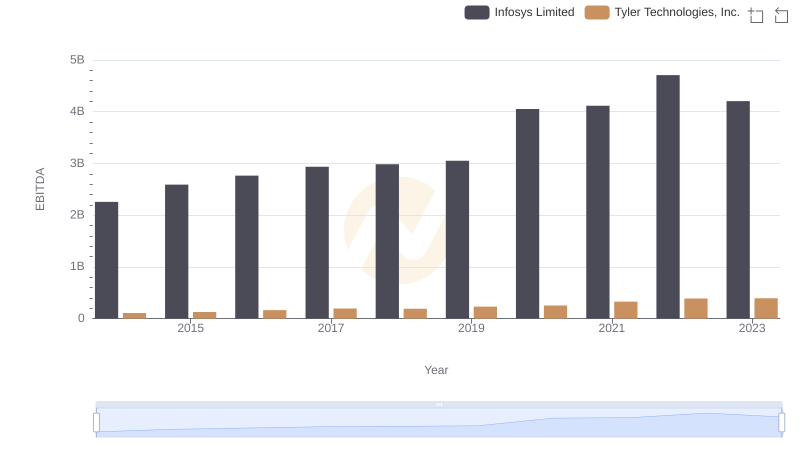
Comprehensive EBITDA Comparison: Infosys Limited vs Tyler Technologies, Inc.