| __timestamp | Infosys Limited | Manhattan Associates, Inc. |
|---|---|---|
| Wednesday, January 1, 2014 | 5374000000 | 212578000 |
| Thursday, January 1, 2015 | 5950000000 | 235428000 |
| Friday, January 1, 2016 | 6446000000 | 249879000 |
| Sunday, January 1, 2017 | 7001000000 | 245733000 |
| Monday, January 1, 2018 | 7687000000 | 240881000 |
| Tuesday, January 1, 2019 | 8552000000 | 284967000 |
| Wednesday, January 1, 2020 | 8828000000 | 269887000 |
| Friday, January 1, 2021 | 10996000000 | 297827000 |
| Saturday, January 1, 2022 | 12709000000 | 358237000 |
| Sunday, January 1, 2023 | 13096000000 | 430614000 |
| Monday, January 1, 2024 | 470980000 |
Data in motion
In the ever-evolving landscape of global business, understanding cost structures is crucial. Infosys Limited, a titan in the IT services sector, and Manhattan Associates, Inc., a leader in supply chain solutions, offer a fascinating study in contrasts. From 2014 to 2023, Infosys's cost of revenue surged by approximately 144%, reflecting its expansive growth and operational scale. In contrast, Manhattan Associates saw a more modest increase of around 103%, indicative of its focused niche market strategy.
Infosys's cost of revenue consistently outpaced Manhattan Associates, highlighting its larger operational footprint. By 2023, Infosys's costs were nearly 30 times greater than those of Manhattan Associates, underscoring the scale at which Infosys operates. This data not only reveals the financial strategies of these companies but also provides a window into their market positioning and growth trajectories.
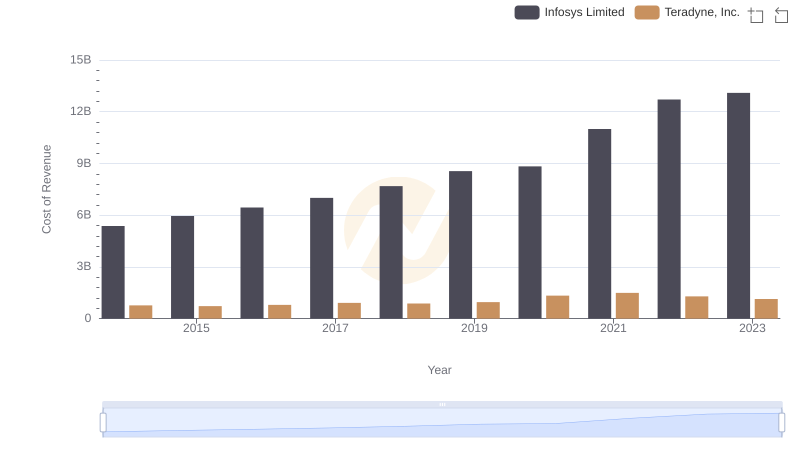
Analyzing Cost of Revenue: Infosys Limited and Teradyne, Inc.
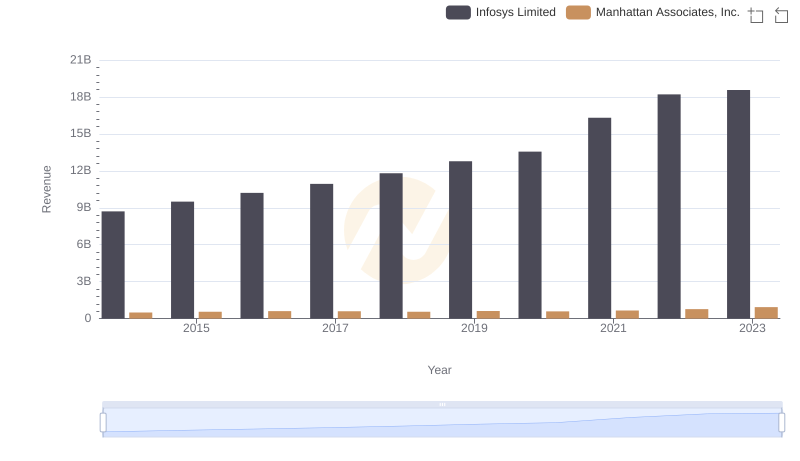
Annual Revenue Comparison: Infosys Limited vs Manhattan Associates, Inc.
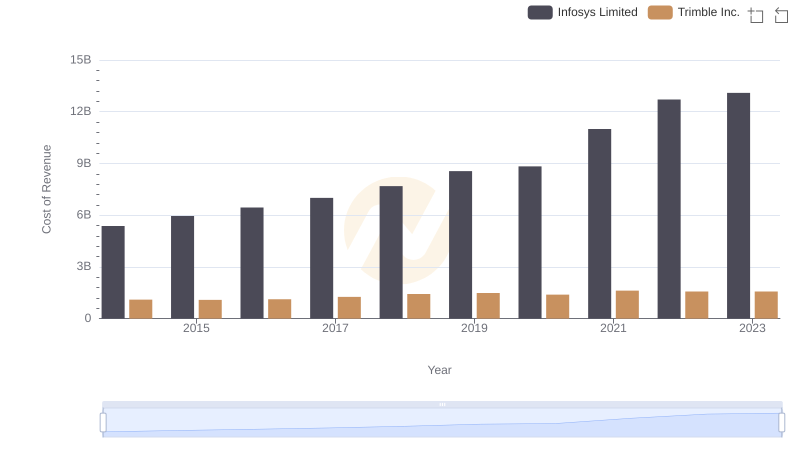
Infosys Limited vs Trimble Inc.: Efficiency in Cost of Revenue Explored
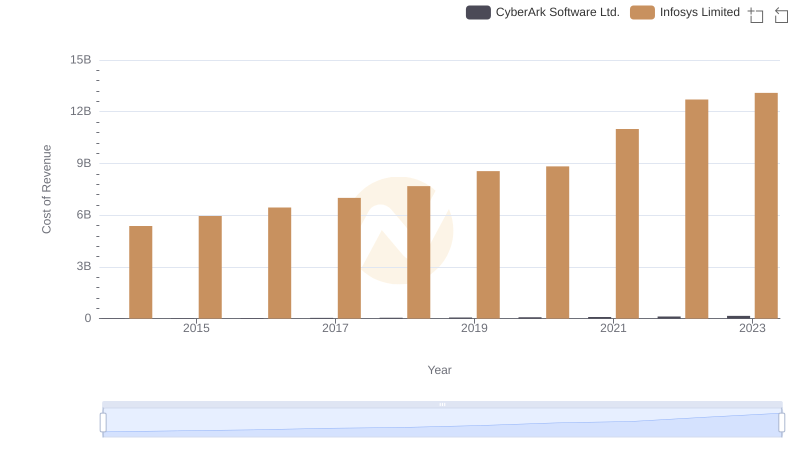
Cost of Revenue: Key Insights for Infosys Limited and CyberArk Software Ltd.
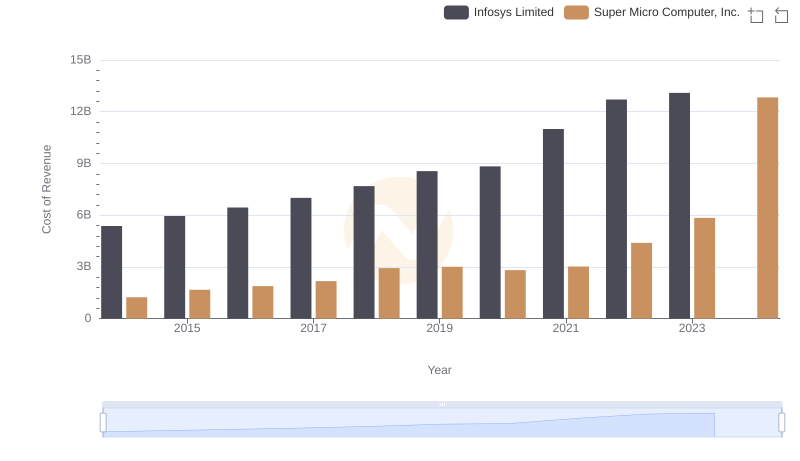
Cost Insights: Breaking Down Infosys Limited and Super Micro Computer, Inc.'s Expenses
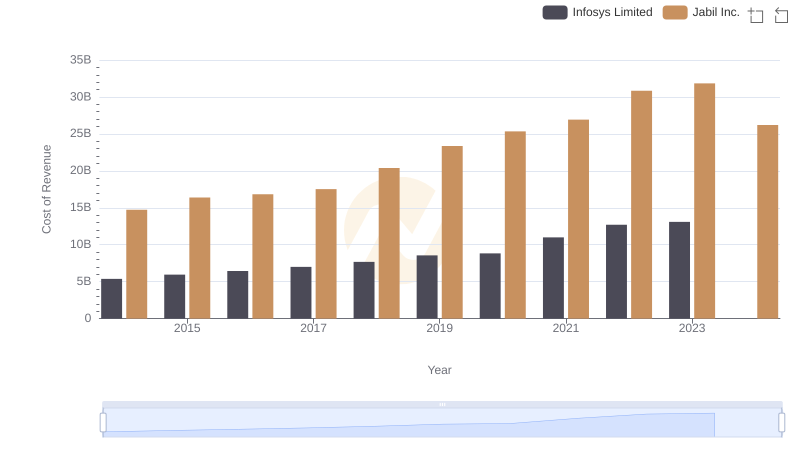
Cost of Revenue: Key Insights for Infosys Limited and Jabil Inc.
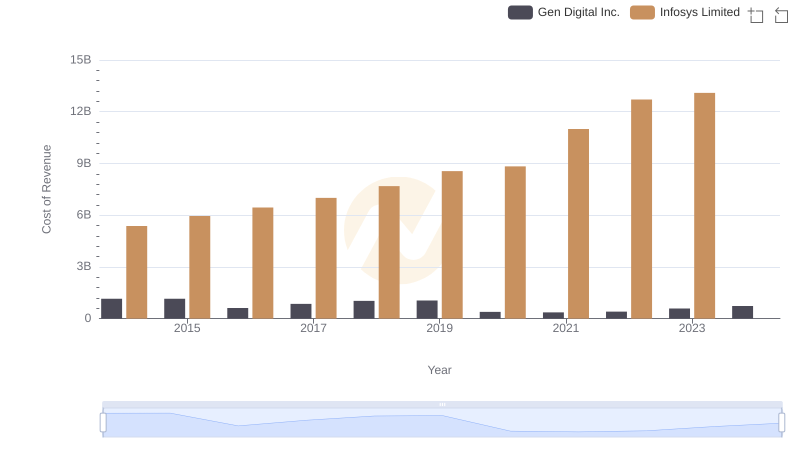
Cost of Revenue Trends: Infosys Limited vs Gen Digital Inc.
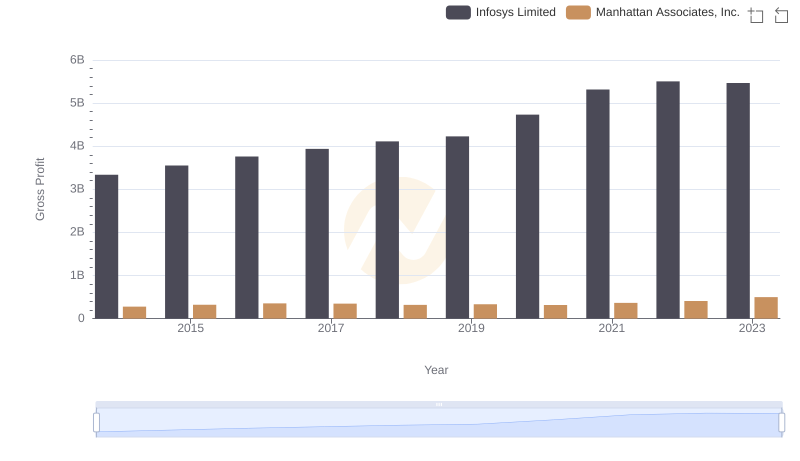
Who Generates Higher Gross Profit? Infosys Limited or Manhattan Associates, Inc.
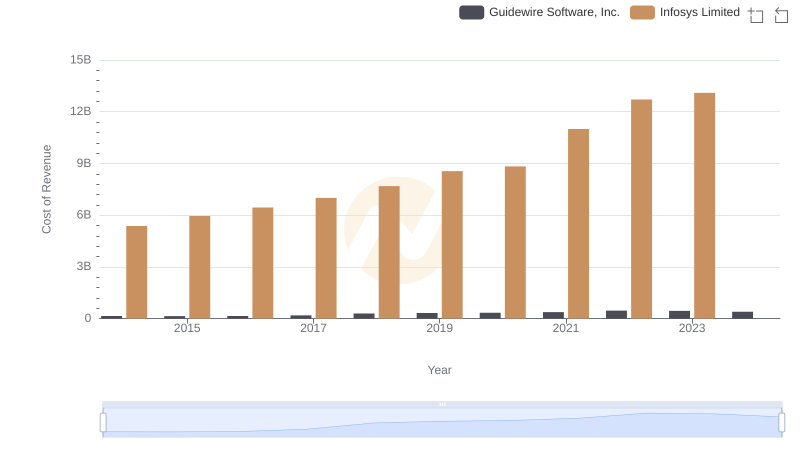
Comparing Cost of Revenue Efficiency: Infosys Limited vs Guidewire Software, Inc.
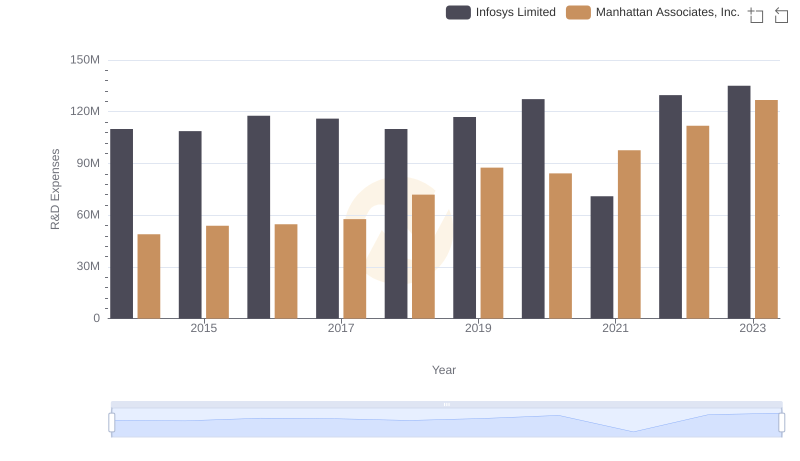
Who Prioritizes Innovation? R&D Spending Compared for Infosys Limited and Manhattan Associates, Inc.
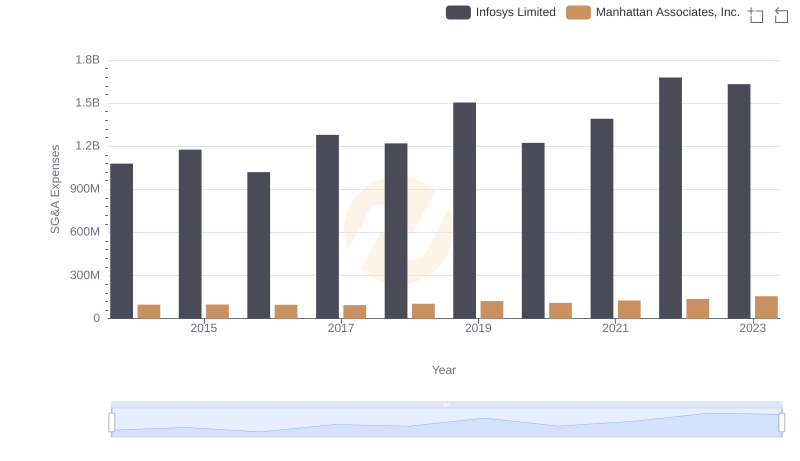
Who Optimizes SG&A Costs Better? Infosys Limited or Manhattan Associates, Inc.
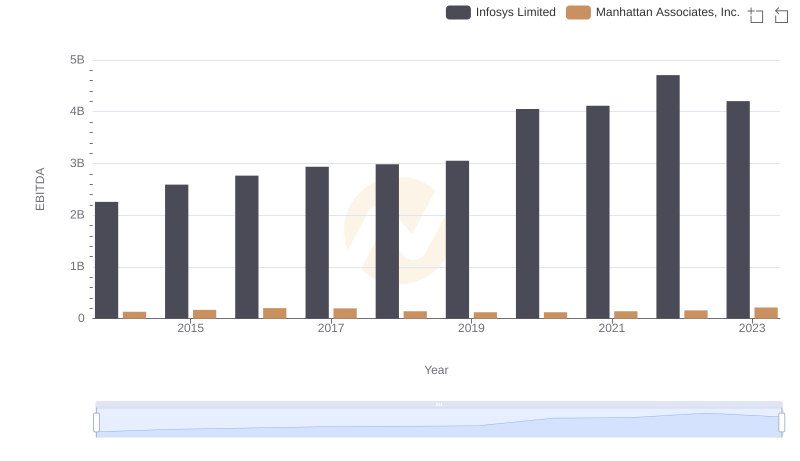
Comprehensive EBITDA Comparison: Infosys Limited vs Manhattan Associates, Inc.