| __timestamp | Infosys Limited | Manhattan Associates, Inc. |
|---|---|---|
| Wednesday, January 1, 2014 | 8711000000 | 492104000 |
| Thursday, January 1, 2015 | 9501000000 | 556371000 |
| Friday, January 1, 2016 | 10208000000 | 604557000 |
| Sunday, January 1, 2017 | 10939000000 | 594599000 |
| Monday, January 1, 2018 | 11799000000 | 559157000 |
| Tuesday, January 1, 2019 | 12780000000 | 617949000 |
| Wednesday, January 1, 2020 | 13561000000 | 586372000 |
| Friday, January 1, 2021 | 16311000000 | 663643000 |
| Saturday, January 1, 2022 | 18212000000 | 767084000 |
| Sunday, January 1, 2023 | 18562000000 | 928725000 |
| Monday, January 1, 2024 | 1042352000 |
Unlocking the unknown
In the ever-evolving landscape of global business, the financial trajectories of companies often tell compelling stories. Over the past decade, Infosys Limited and Manhattan Associates, Inc. have showcased contrasting revenue growth patterns. From 2014 to 2023, Infosys Limited has seen its annual revenue soar by over 110%, reflecting its robust expansion in the IT services sector. In contrast, Manhattan Associates, Inc., a leader in supply chain solutions, experienced a more modest growth of approximately 89% during the same period.
These figures not only reflect the companies' individual strategies but also the broader economic trends influencing their respective industries.
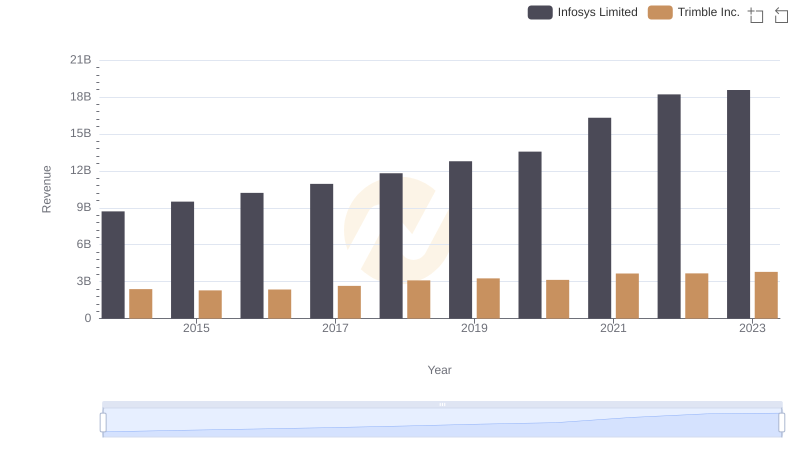
Revenue Showdown: Infosys Limited vs Trimble Inc.
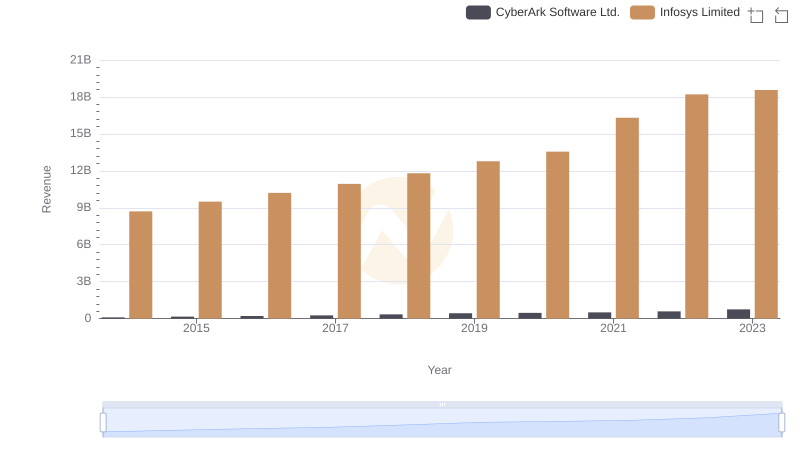
Infosys Limited or CyberArk Software Ltd.: Who Leads in Yearly Revenue?
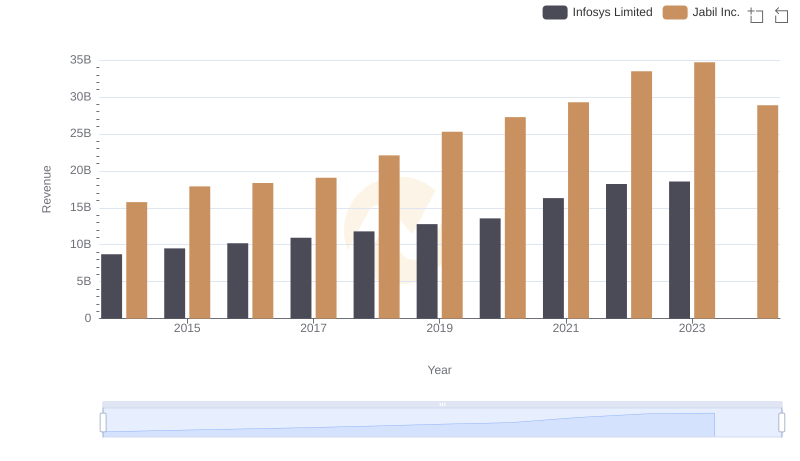
Infosys Limited and Jabil Inc.: A Comprehensive Revenue Analysis
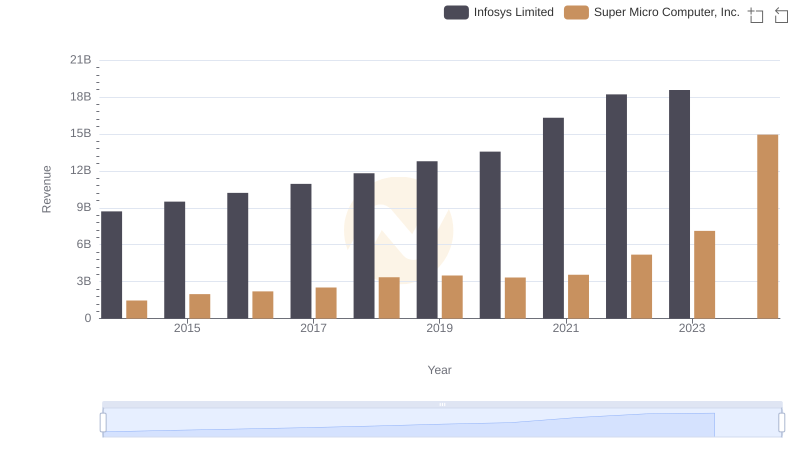
Infosys Limited or Super Micro Computer, Inc.: Who Leads in Yearly Revenue?
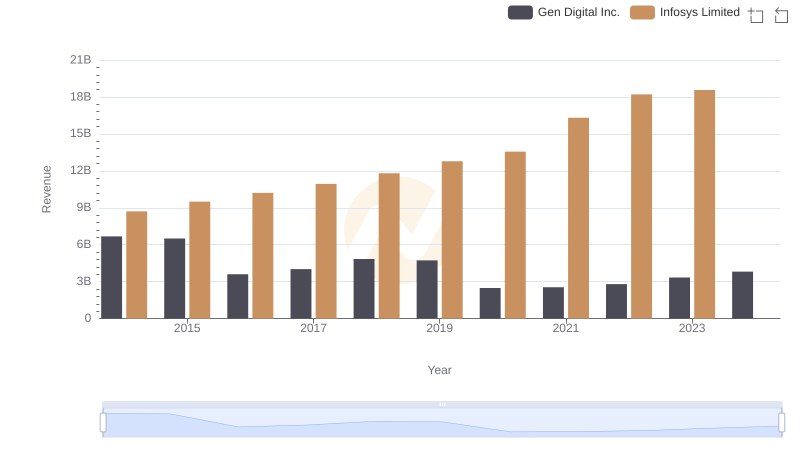
Annual Revenue Comparison: Infosys Limited vs Gen Digital Inc.
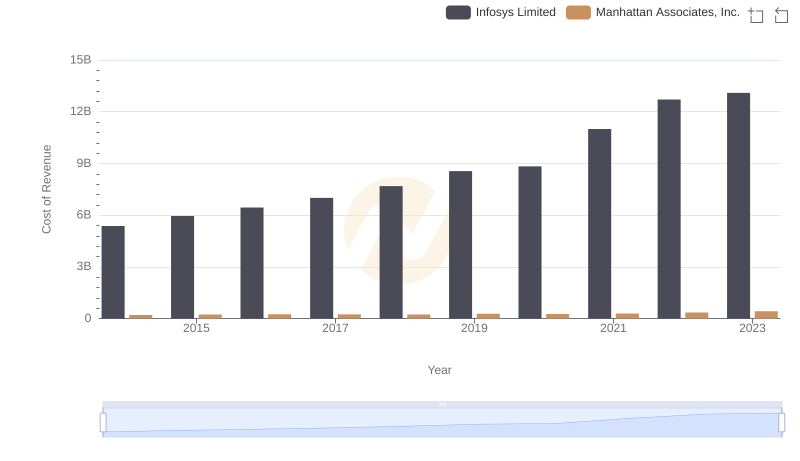
Cost of Revenue Trends: Infosys Limited vs Manhattan Associates, Inc.
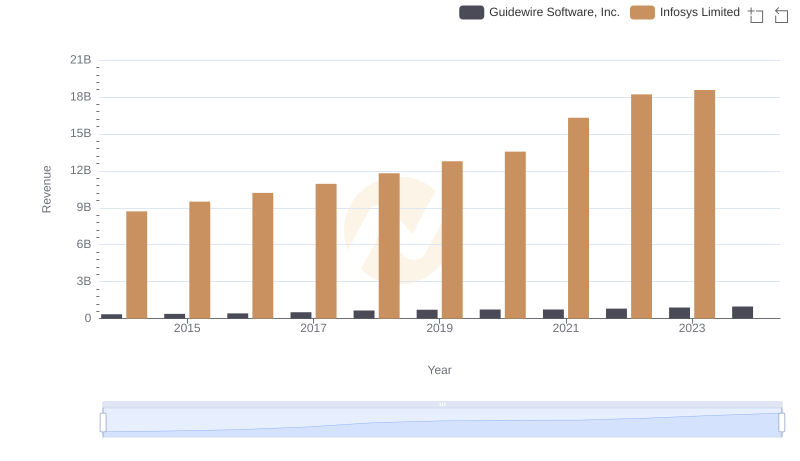
Breaking Down Revenue Trends: Infosys Limited vs Guidewire Software, Inc.
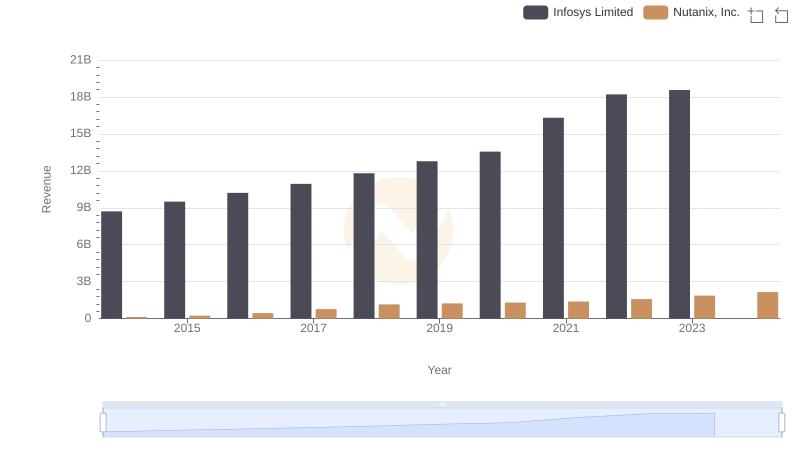
Revenue Insights: Infosys Limited and Nutanix, Inc. Performance Compared
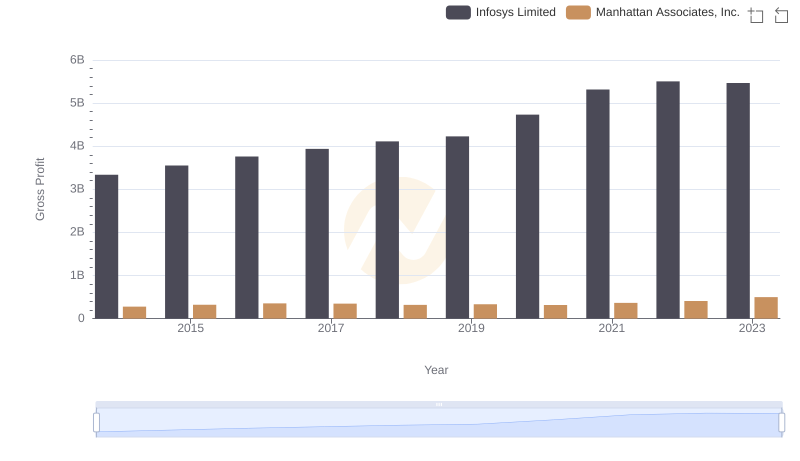
Who Generates Higher Gross Profit? Infosys Limited or Manhattan Associates, Inc.
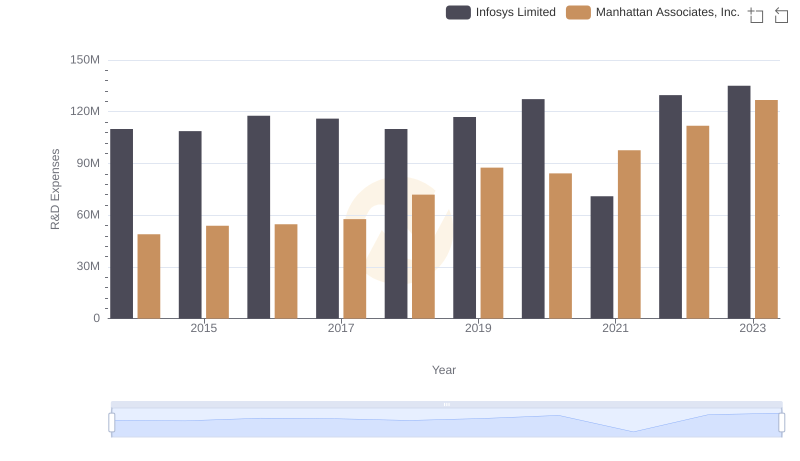
Who Prioritizes Innovation? R&D Spending Compared for Infosys Limited and Manhattan Associates, Inc.
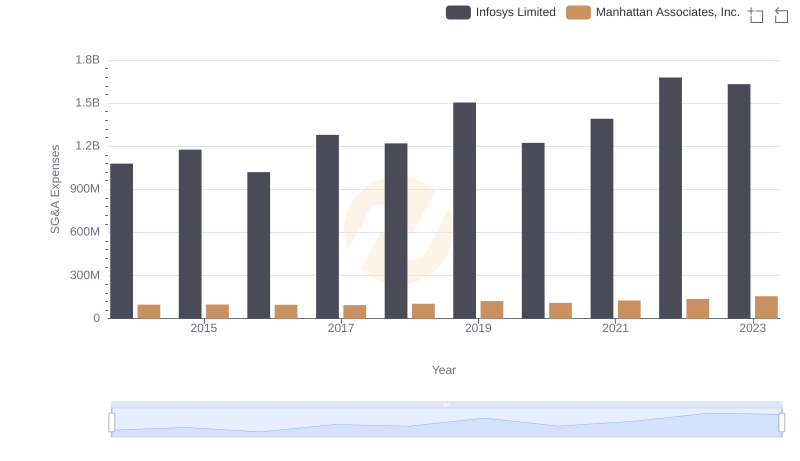
Who Optimizes SG&A Costs Better? Infosys Limited or Manhattan Associates, Inc.
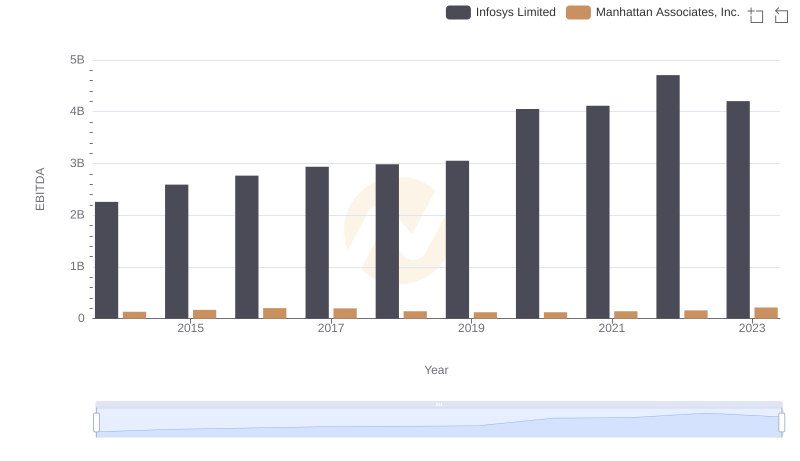
Comprehensive EBITDA Comparison: Infosys Limited vs Manhattan Associates, Inc.