| __timestamp | Fortive Corporation | Infosys Limited |
|---|---|---|
| Wednesday, January 1, 2014 | 3049200000 | 3337000000 |
| Thursday, January 1, 2015 | 2995300000 | 3551000000 |
| Friday, January 1, 2016 | 3032800000 | 3762000000 |
| Sunday, January 1, 2017 | 3298500000 | 3938000000 |
| Monday, January 1, 2018 | 3321300000 | 4112000000 |
| Tuesday, January 1, 2019 | 3680300000 | 4228000000 |
| Wednesday, January 1, 2020 | 2608500000 | 4733000000 |
| Friday, January 1, 2021 | 3007100000 | 5315000000 |
| Saturday, January 1, 2022 | 3363400000 | 5503000000 |
| Sunday, January 1, 2023 | 3594100000 | 5466000000 |
| Monday, January 1, 2024 | 3731000000 |
Unveiling the hidden dimensions of data
In the ever-evolving landscape of global business, understanding the financial health of leading corporations is crucial. This analysis delves into the gross profit trends of two industry giants: Infosys Limited and Fortive Corporation, from 2014 to 2023.
Infosys Limited, a titan in the IT services sector, has demonstrated a robust growth trajectory, with its gross profit increasing by approximately 64% over the decade. Notably, the year 2021 marked a significant peak, with a gross profit of $5.315 billion, reflecting a 42% increase from 2014.
Conversely, Fortive Corporation, a leader in industrial technology, experienced a more fluctuating pattern. Despite a dip in 2020, its gross profit rebounded by 38% in 2023, reaching $3.594 billion. This resilience underscores Fortive's adaptability in a competitive market.
This comparative analysis highlights the distinct growth patterns and strategic resilience of these two corporations, offering valuable insights for investors and industry analysts alike.
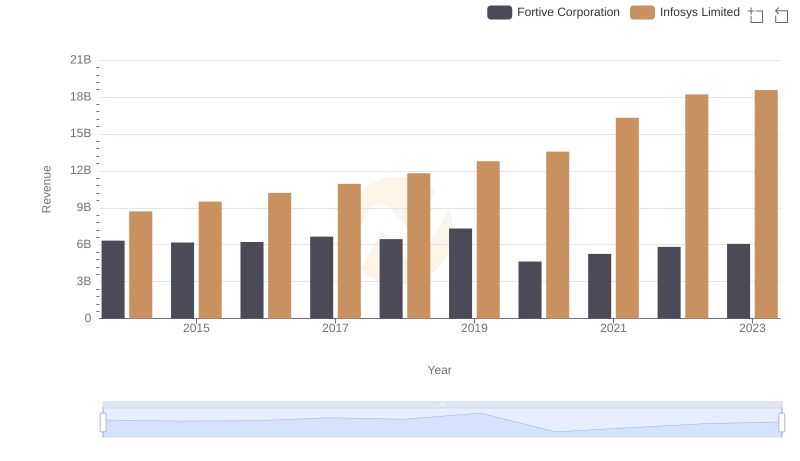
Who Generates More Revenue? Infosys Limited or Fortive Corporation
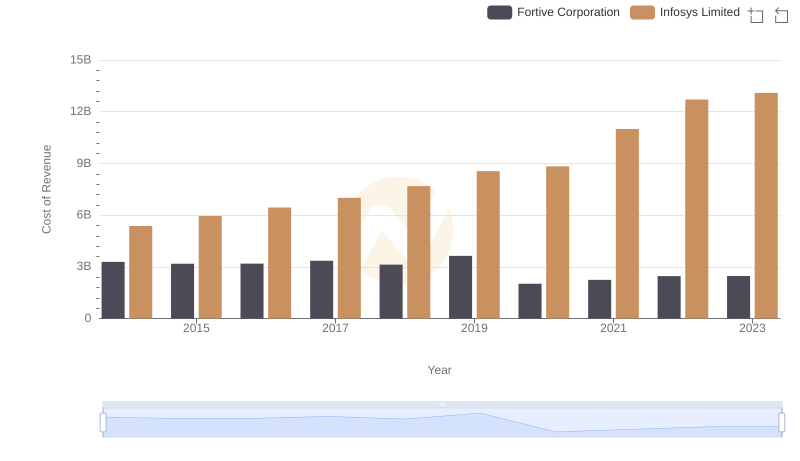
Comparing Cost of Revenue Efficiency: Infosys Limited vs Fortive Corporation
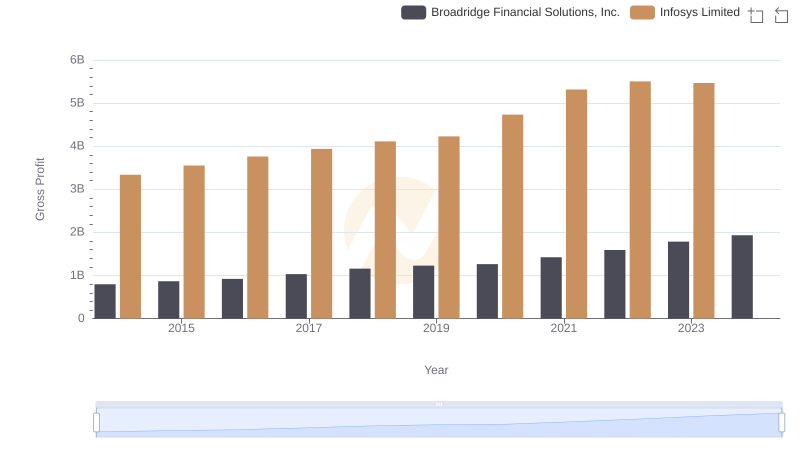
Gross Profit Comparison: Infosys Limited and Broadridge Financial Solutions, Inc. Trends
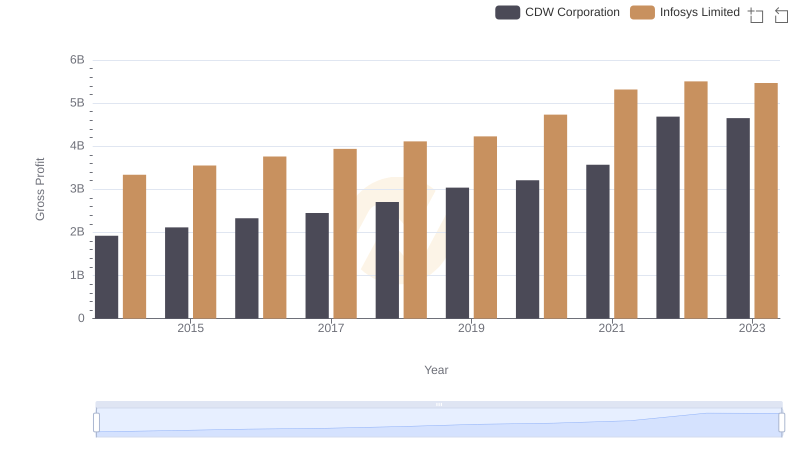
Who Generates Higher Gross Profit? Infosys Limited or CDW Corporation
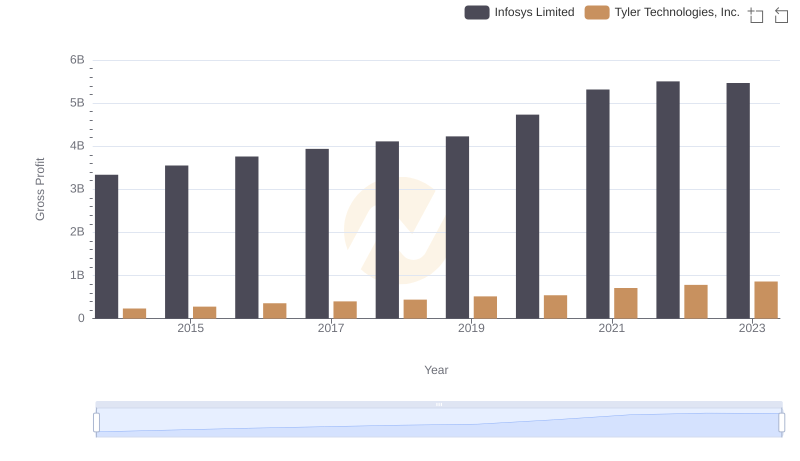
Gross Profit Trends Compared: Infosys Limited vs Tyler Technologies, Inc.
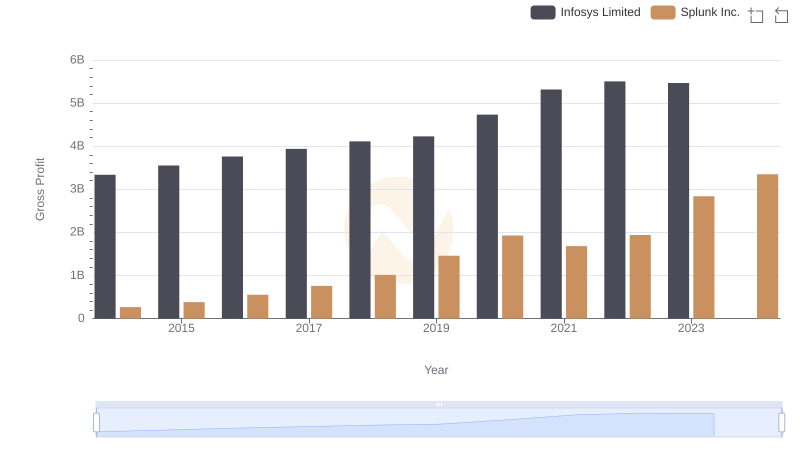
Infosys Limited and Splunk Inc.: A Detailed Gross Profit Analysis
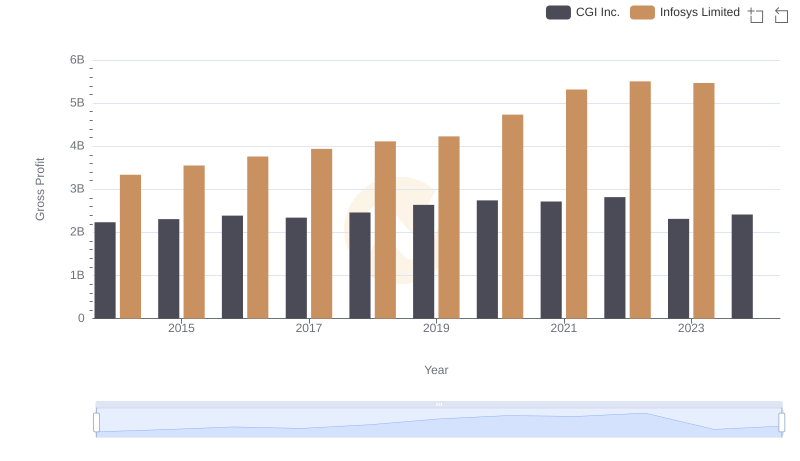
Gross Profit Comparison: Infosys Limited and CGI Inc. Trends
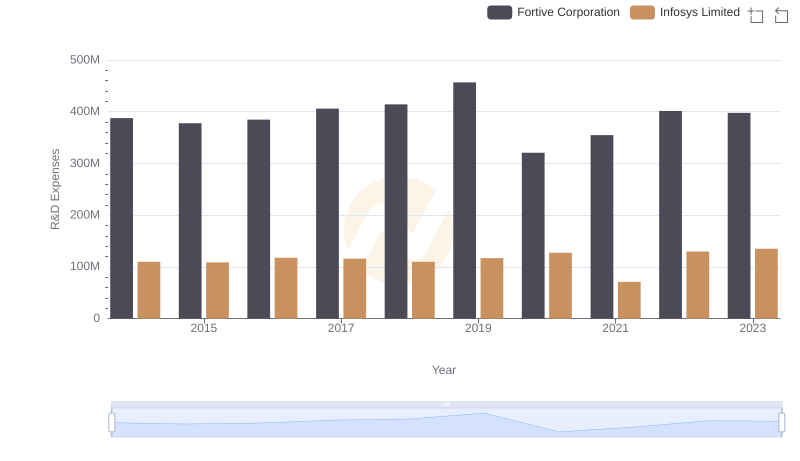
R&D Insights: How Infosys Limited and Fortive Corporation Allocate Funds
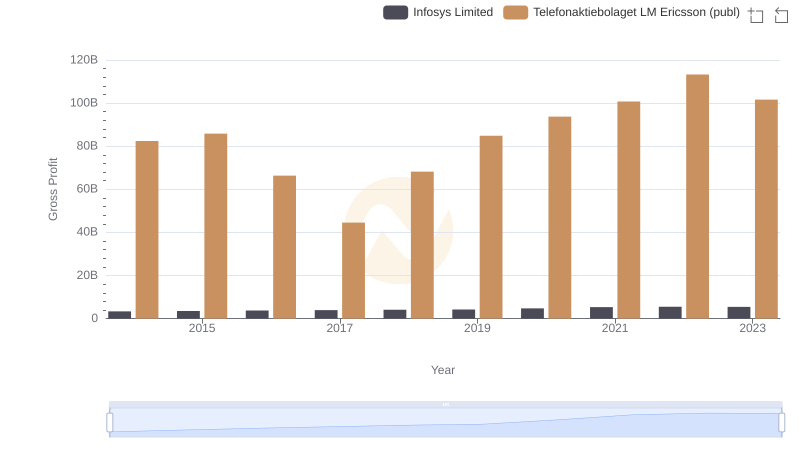
Who Generates Higher Gross Profit? Infosys Limited or Telefonaktiebolaget LM Ericsson (publ)
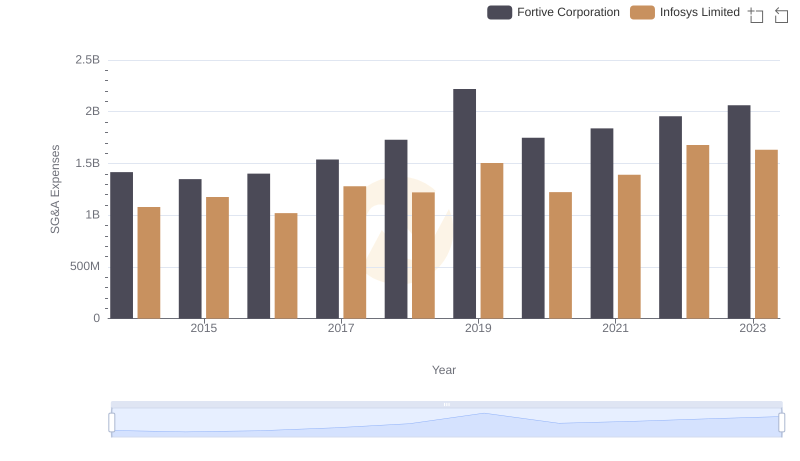
Infosys Limited vs Fortive Corporation: SG&A Expense Trends
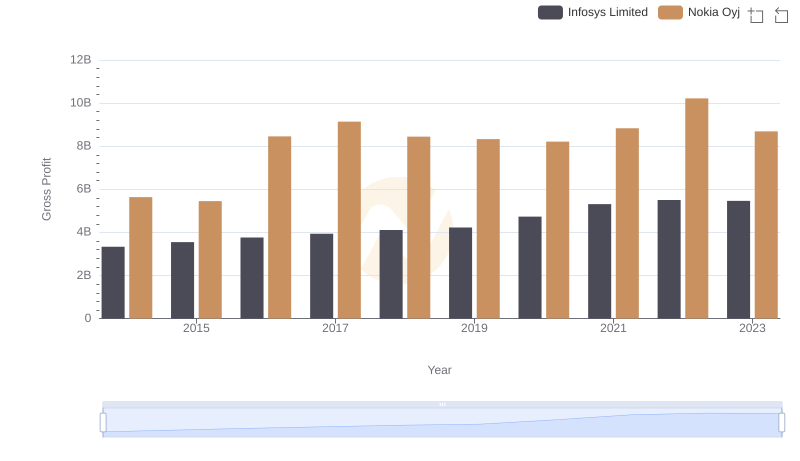
Key Insights on Gross Profit: Infosys Limited vs Nokia Oyj
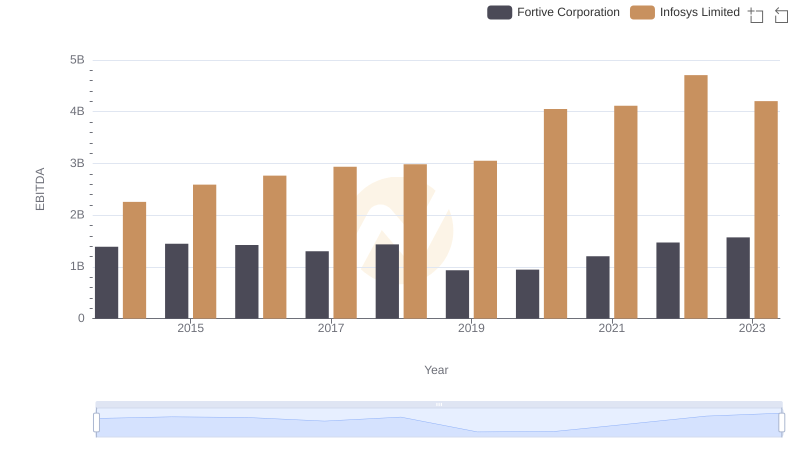
Comprehensive EBITDA Comparison: Infosys Limited vs Fortive Corporation