| __timestamp | Cintas Corporation | General Dynamics Corporation |
|---|---|---|
| Wednesday, January 1, 2014 | 793811000 | 4401000000 |
| Thursday, January 1, 2015 | 877761000 | 4682000000 |
| Friday, January 1, 2016 | 933728000 | 4208000000 |
| Sunday, January 1, 2017 | 968293000 | 4635000000 |
| Monday, January 1, 2018 | 1227852000 | 5222000000 |
| Tuesday, January 1, 2019 | 1564228000 | 5503000000 |
| Wednesday, January 1, 2020 | 1542737000 | 5105000000 |
| Friday, January 1, 2021 | 1773591000 | 5194000000 |
| Saturday, January 1, 2022 | 1990046000 | 5311000000 |
| Sunday, January 1, 2023 | 2221676000 | 5246000000 |
| Monday, January 1, 2024 | 2523857000 | 5819000000 |
Unveiling the hidden dimensions of data
In the competitive landscape of corporate America, Cintas Corporation and General Dynamics Corporation have showcased remarkable financial trajectories over the past decade. From 2014 to 2024, Cintas has seen its EBITDA grow by an impressive 218%, reflecting its strategic expansions and operational efficiencies. In contrast, General Dynamics, a stalwart in the defense sector, has maintained a steady EBITDA growth of approximately 9% over the same period, underscoring its resilience in a fluctuating market.
This comparative analysis offers a glimpse into the strategic maneuvers and market dynamics that have shaped these industry giants.
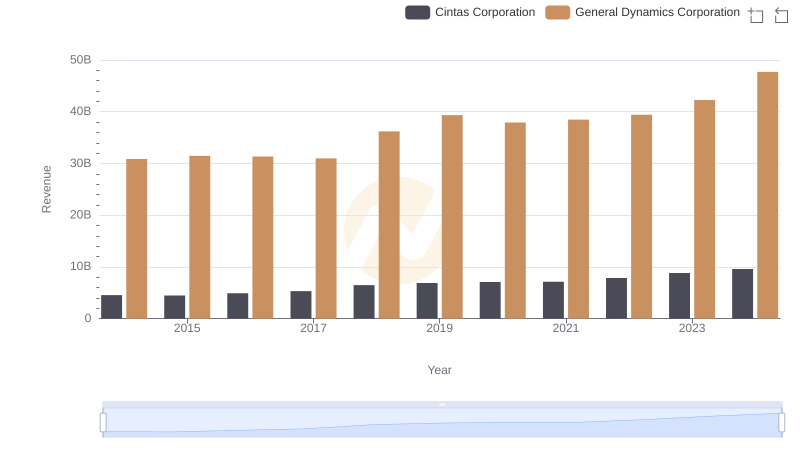
Comparing Revenue Performance: Cintas Corporation or General Dynamics Corporation?
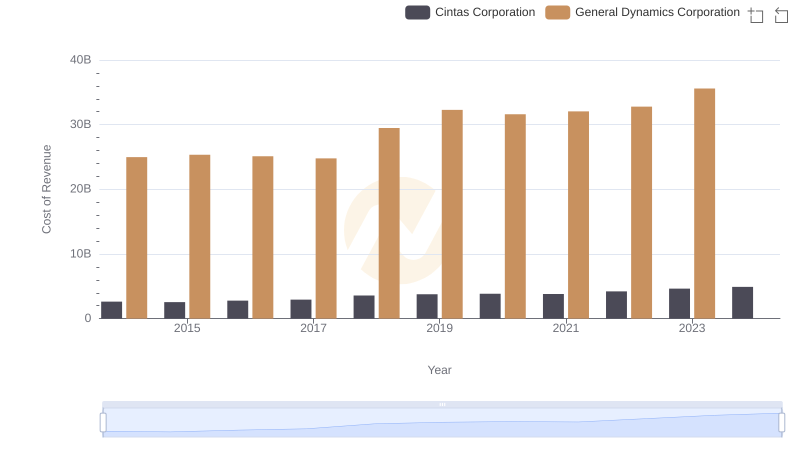
Cintas Corporation vs General Dynamics Corporation: Efficiency in Cost of Revenue Explored
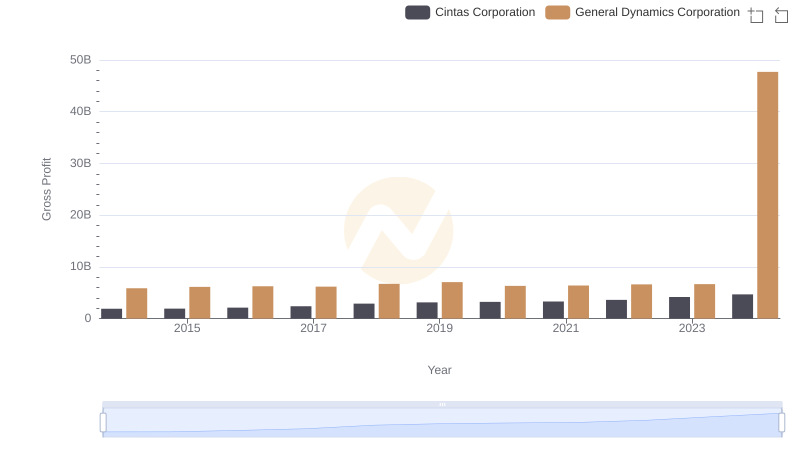
Gross Profit Trends Compared: Cintas Corporation vs General Dynamics Corporation
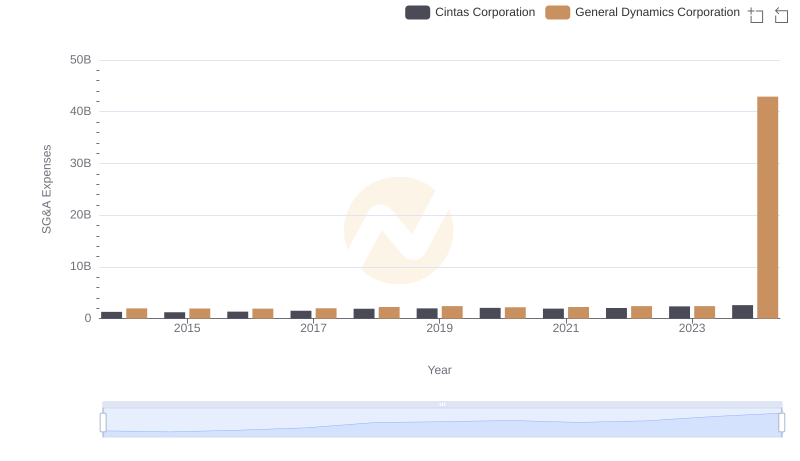
Comparing SG&A Expenses: Cintas Corporation vs General Dynamics Corporation Trends and Insights
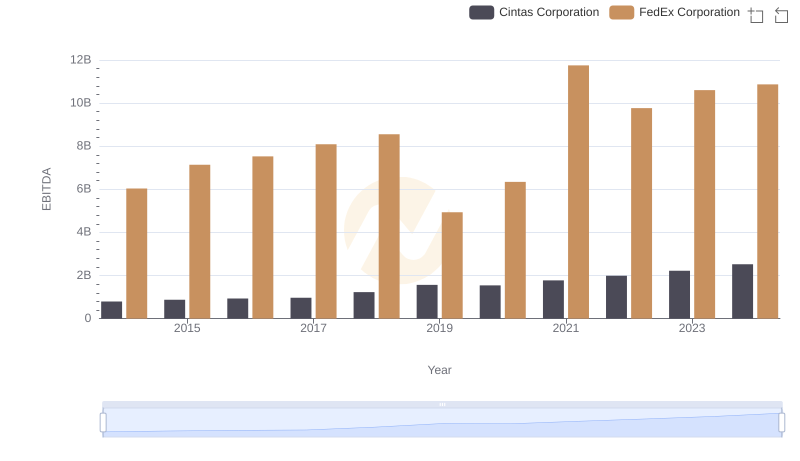
Professional EBITDA Benchmarking: Cintas Corporation vs FedEx Corporation
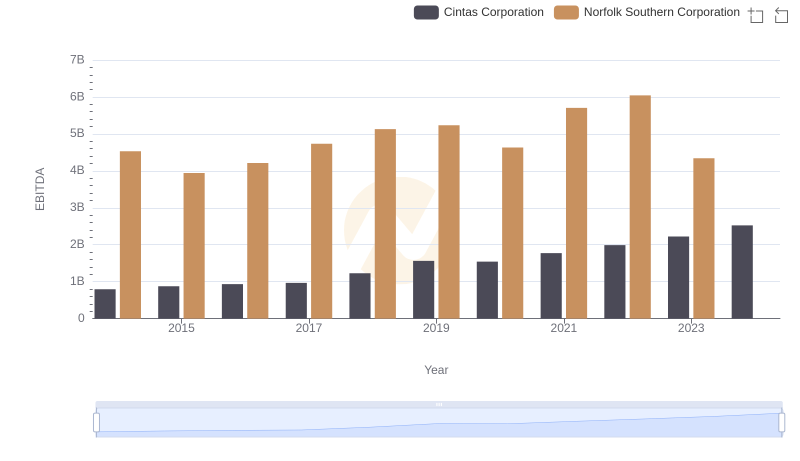
A Side-by-Side Analysis of EBITDA: Cintas Corporation and Norfolk Southern Corporation
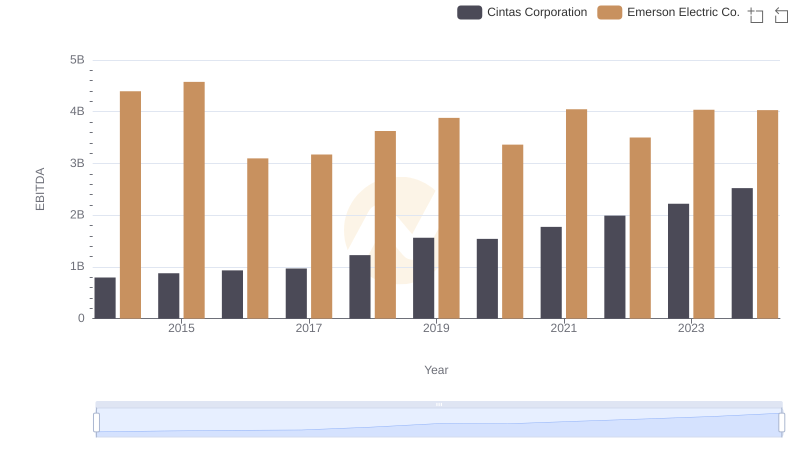
Comparative EBITDA Analysis: Cintas Corporation vs Emerson Electric Co.
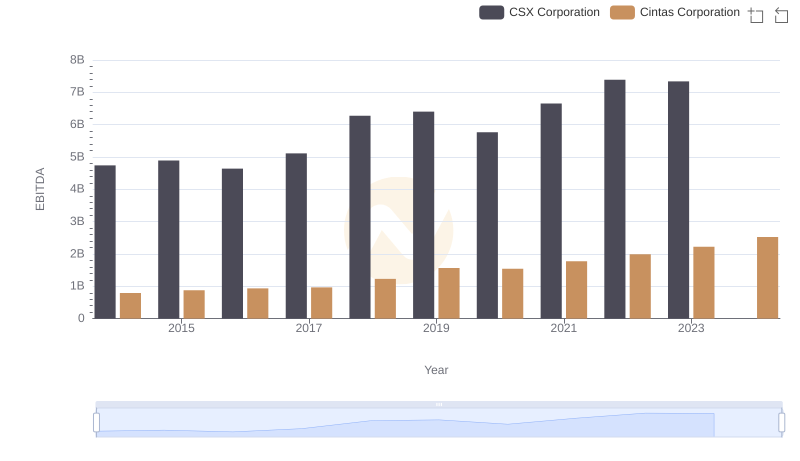
A Side-by-Side Analysis of EBITDA: Cintas Corporation and CSX Corporation
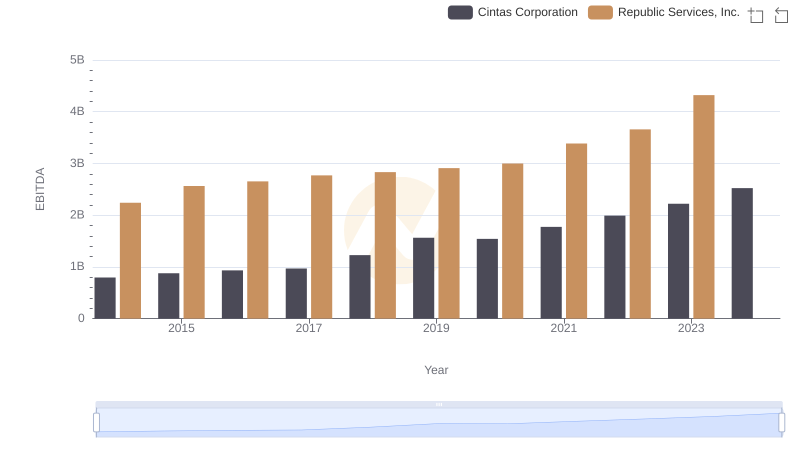
Cintas Corporation and Republic Services, Inc.: A Detailed Examination of EBITDA Performance
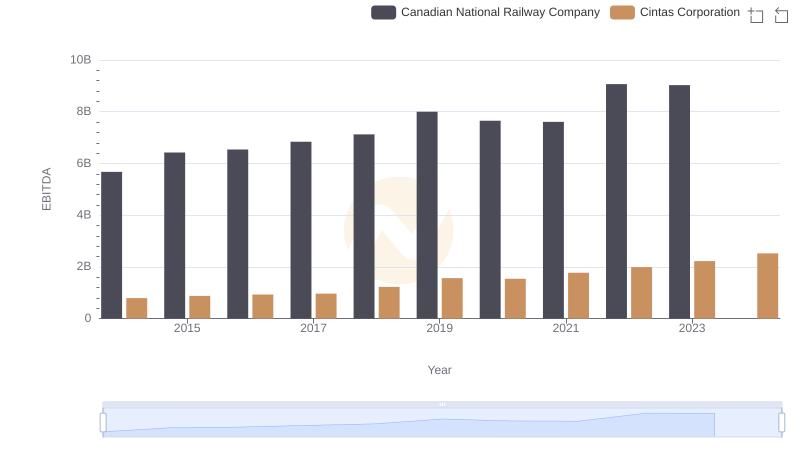
Professional EBITDA Benchmarking: Cintas Corporation vs Canadian National Railway Company
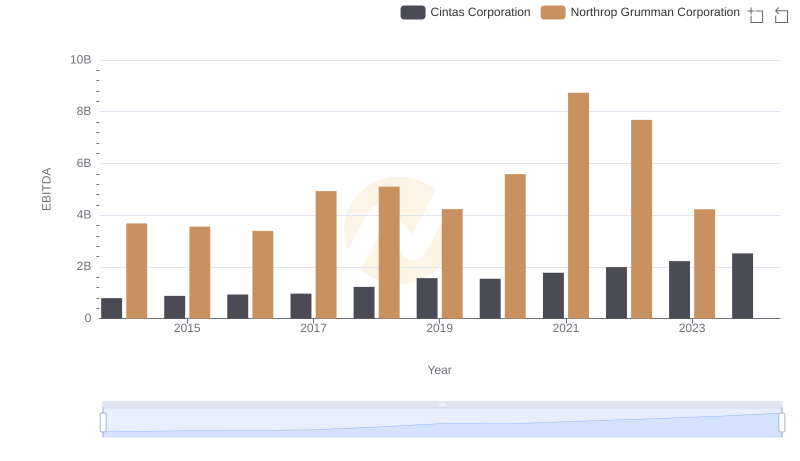
Comparative EBITDA Analysis: Cintas Corporation vs Northrop Grumman Corporation
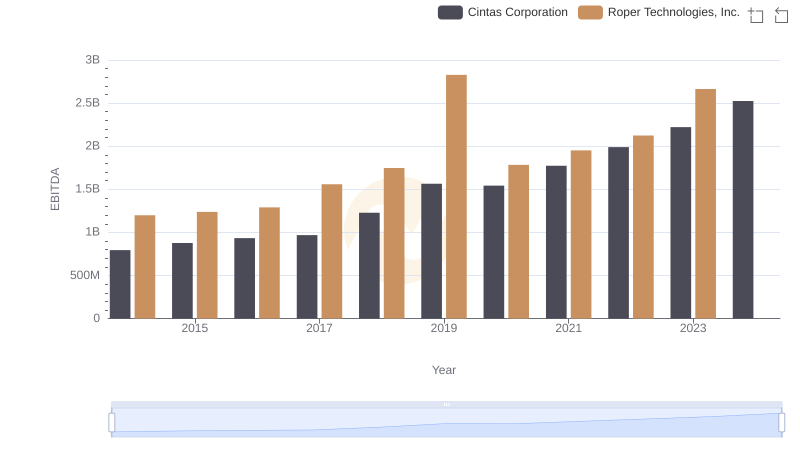
Comprehensive EBITDA Comparison: Cintas Corporation vs Roper Technologies, Inc.