| __timestamp | Ryanair Holdings plc | Snap-on Incorporated |
|---|---|---|
| Wednesday, January 1, 2014 | 192800000 | 1047900000 |
| Thursday, January 1, 2015 | 233900000 | 1009100000 |
| Friday, January 1, 2016 | 292700000 | 1001400000 |
| Sunday, January 1, 2017 | 322300000 | 1101300000 |
| Monday, January 1, 2018 | 410400000 | 1080700000 |
| Tuesday, January 1, 2019 | 547300000 | 1071500000 |
| Wednesday, January 1, 2020 | 578800000 | 1054800000 |
| Friday, January 1, 2021 | 201500000 | 1202300000 |
| Saturday, January 1, 2022 | 411300000 | 1181200000 |
| Sunday, January 1, 2023 | 674400000 | 1249000000 |
| Monday, January 1, 2024 | 757200000 | 0 |
Unveiling the hidden dimensions of data
Over the past decade, Ryanair Holdings plc and Snap-on Incorporated have showcased contrasting trends in their Selling, General, and Administrative (SG&A) expenses. From 2014 to 2023, Ryanair's SG&A expenses surged by approximately 293%, reflecting its aggressive expansion and operational strategies. In contrast, Snap-on's expenses grew by about 19%, indicating a more stable and controlled financial approach.
Ryanair's expenses peaked in 2024, reaching a remarkable 757 million, while Snap-on's data for the same year remains unavailable. Notably, 2021 marked a significant dip for Ryanair, with expenses dropping to 201 million, possibly due to pandemic-related operational adjustments. Meanwhile, Snap-on's expenses consistently hovered around the 1.1 billion mark, peaking in 2023 at 1.25 billion.
These insights reveal the dynamic financial strategies of two industry giants, offering valuable lessons in cost management and growth adaptation.
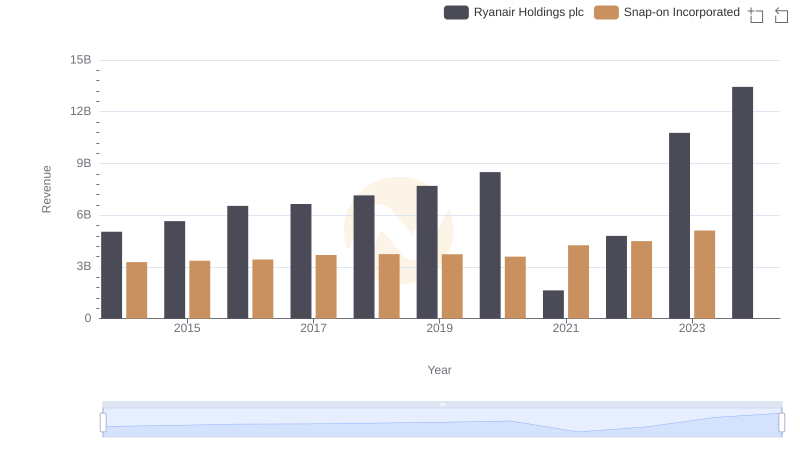
Ryanair Holdings plc vs Snap-on Incorporated: Examining Key Revenue Metrics
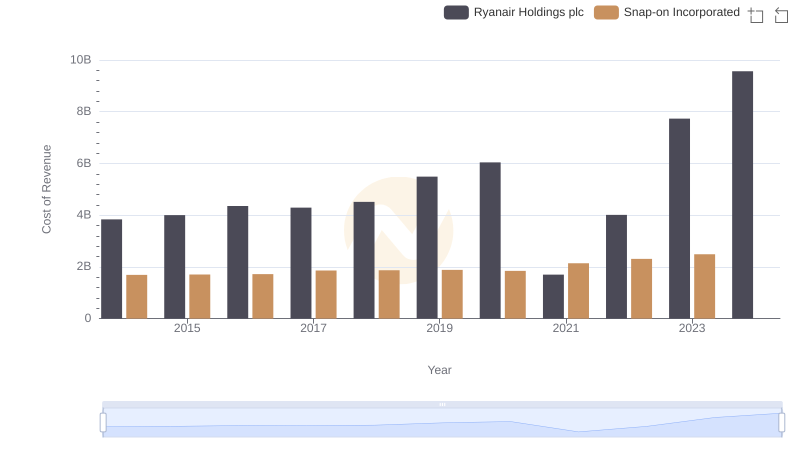
Comparing Cost of Revenue Efficiency: Ryanair Holdings plc vs Snap-on Incorporated
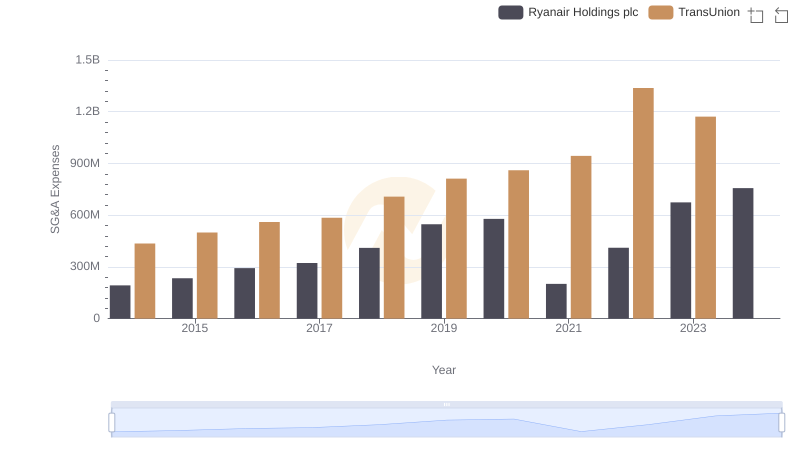
Comparing SG&A Expenses: Ryanair Holdings plc vs TransUnion Trends and Insights
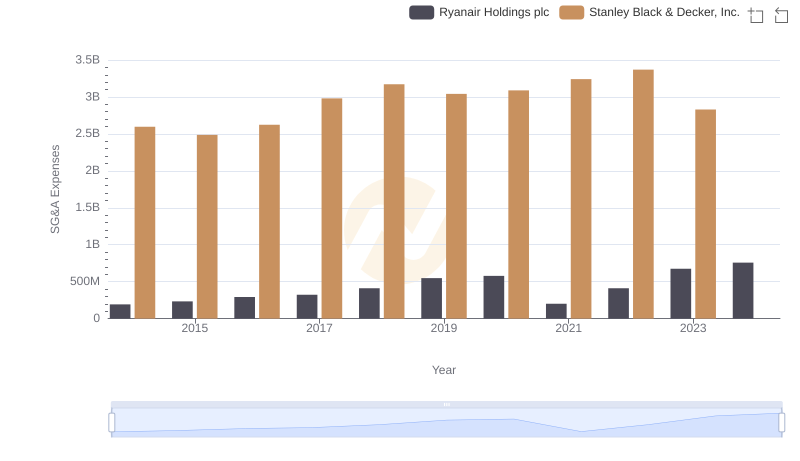
Operational Costs Compared: SG&A Analysis of Ryanair Holdings plc and Stanley Black & Decker, Inc.
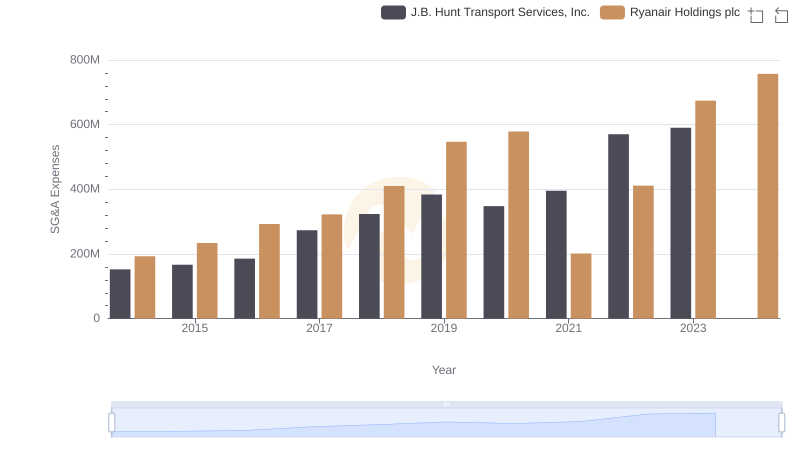
Selling, General, and Administrative Costs: Ryanair Holdings plc vs J.B. Hunt Transport Services, Inc.
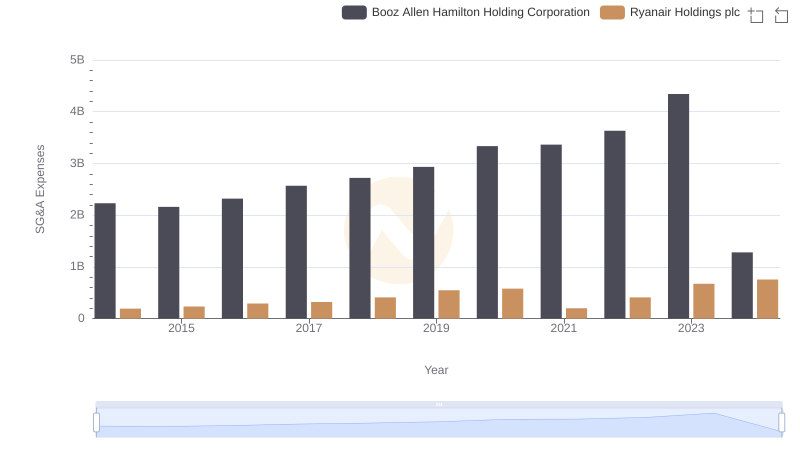
Cost Management Insights: SG&A Expenses for Ryanair Holdings plc and Booz Allen Hamilton Holding Corporation
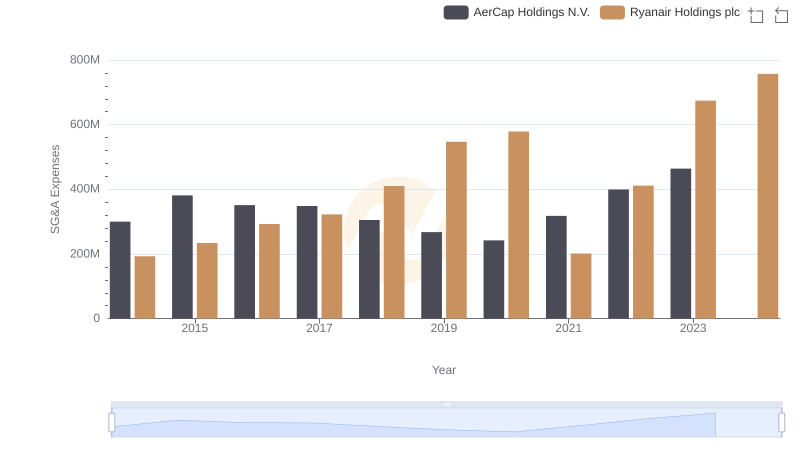
Ryanair Holdings plc and AerCap Holdings N.V.: SG&A Spending Patterns Compared
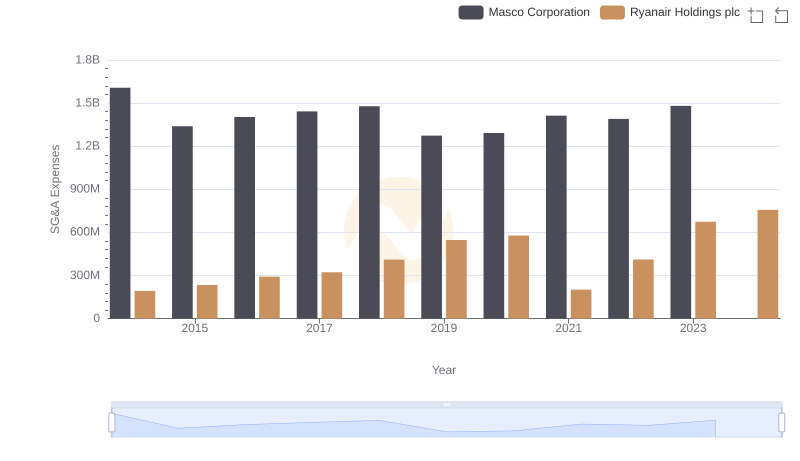
Cost Management Insights: SG&A Expenses for Ryanair Holdings plc and Masco Corporation
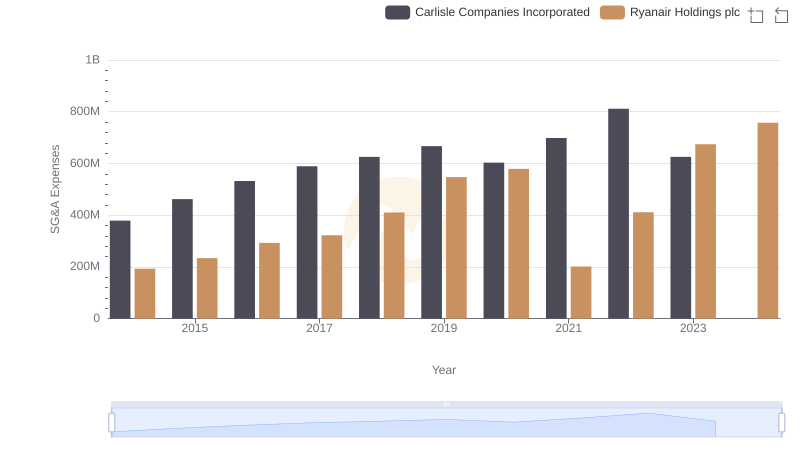
Selling, General, and Administrative Costs: Ryanair Holdings plc vs Carlisle Companies Incorporated
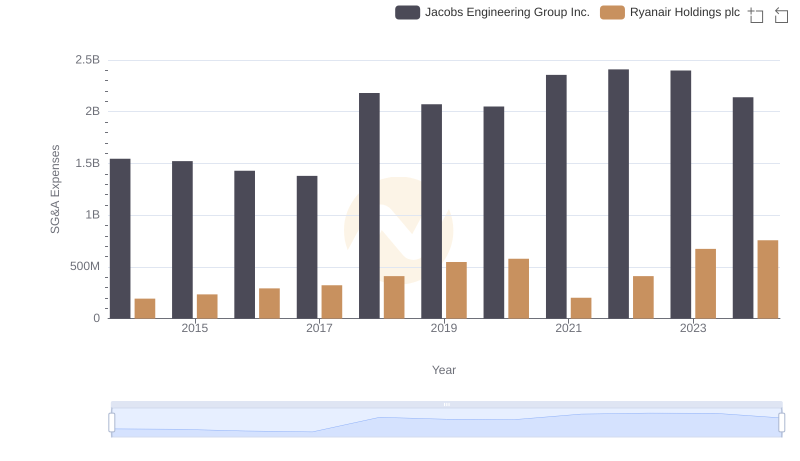
Who Optimizes SG&A Costs Better? Ryanair Holdings plc or Jacobs Engineering Group Inc.
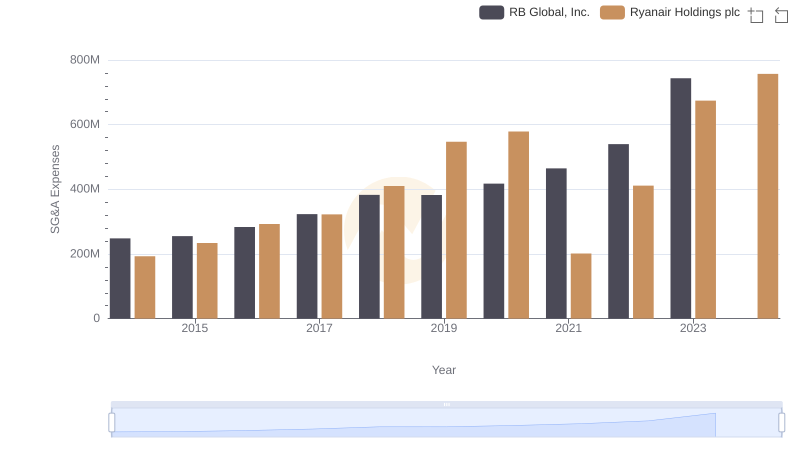
Comparing SG&A Expenses: Ryanair Holdings plc vs RB Global, Inc. Trends and Insights
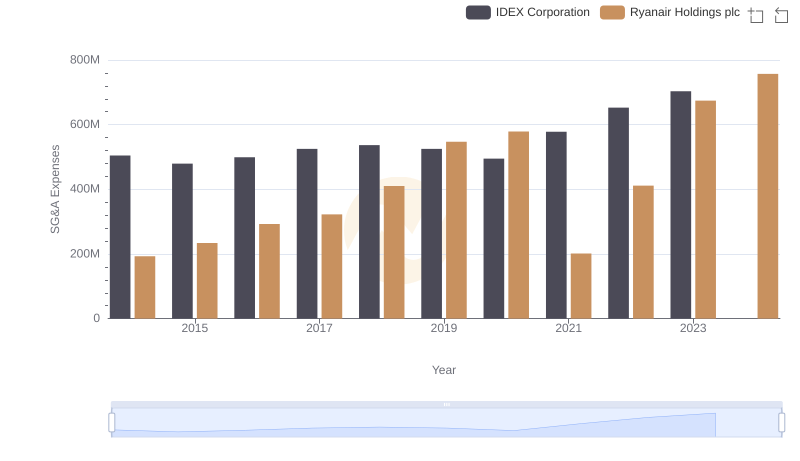
Ryanair Holdings plc and IDEX Corporation: SG&A Spending Patterns Compared