| __timestamp | China Eastern Airlines Corporation Limited | Ryanair Holdings plc |
|---|---|---|
| Wednesday, January 1, 2014 | 4120000000 | 192800000 |
| Thursday, January 1, 2015 | 3651000000 | 233900000 |
| Friday, January 1, 2016 | 3133000000 | 292700000 |
| Sunday, January 1, 2017 | 3294000000 | 322300000 |
| Monday, January 1, 2018 | 3807000000 | 410400000 |
| Tuesday, January 1, 2019 | 4134000000 | 547300000 |
| Wednesday, January 1, 2020 | 1570000000 | 578800000 |
| Friday, January 1, 2021 | 1128000000 | 201500000 |
| Saturday, January 1, 2022 | 2933000000 | 411300000 |
| Sunday, January 1, 2023 | 7254000000 | 674400000 |
| Monday, January 1, 2024 | 757200000 |
In pursuit of knowledge
In the ever-evolving aviation industry, understanding the financial dynamics of major players is crucial. This analysis delves into the Selling, General, and Administrative (SG&A) expenses of Ryanair Holdings plc and China Eastern Airlines Corporation Limited from 2014 to 2023. Over this period, China Eastern Airlines consistently reported higher SG&A expenses, peaking in 2023 with a staggering 7.25 billion, a 130% increase from its 2020 low. In contrast, Ryanair's expenses remained relatively stable, with a notable increase of 250% from 2014 to 2023, reaching 675 million. The data highlights the contrasting financial strategies of these airlines, with China Eastern's expenses showing more volatility. Notably, 2024 data for China Eastern is missing, leaving room for speculation on future trends. This financial insight provides a window into the operational priorities and market strategies of these aviation giants.
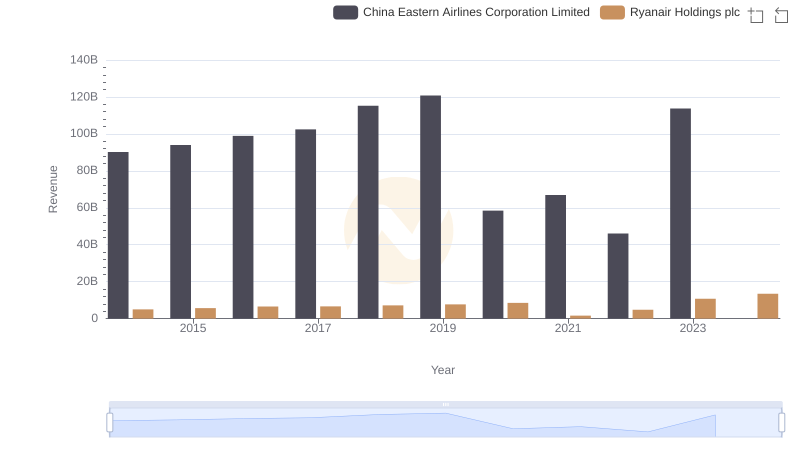
Ryanair Holdings plc vs China Eastern Airlines Corporation Limited: Examining Key Revenue Metrics
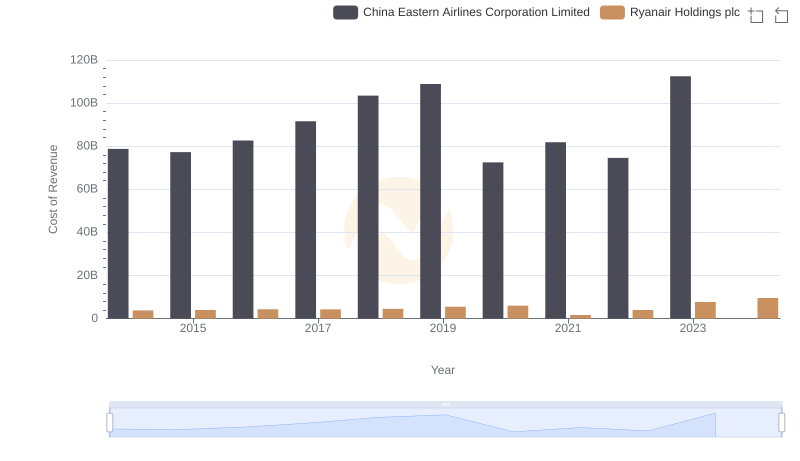
Ryanair Holdings plc vs China Eastern Airlines Corporation Limited: Efficiency in Cost of Revenue Explored
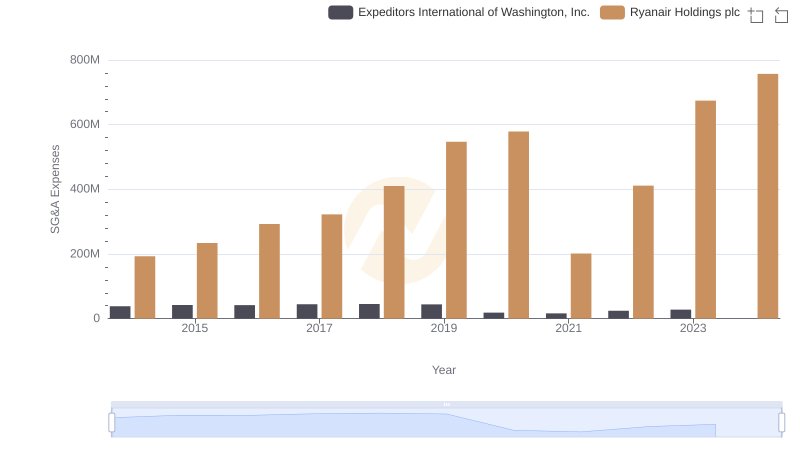
Selling, General, and Administrative Costs: Ryanair Holdings plc vs Expeditors International of Washington, Inc.
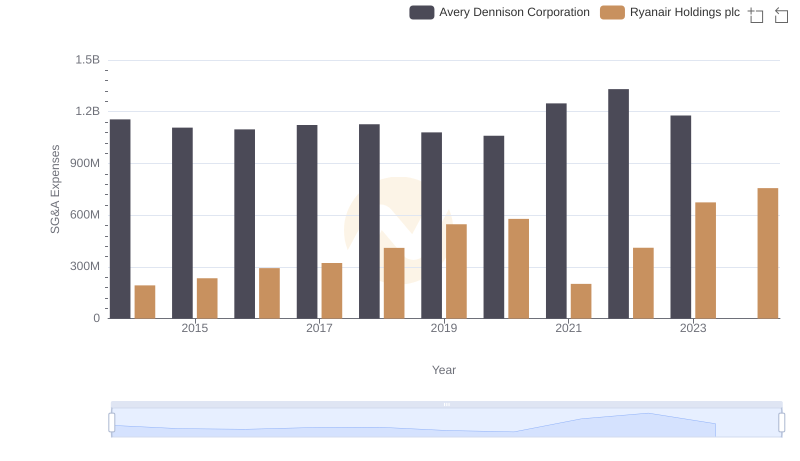
Breaking Down SG&A Expenses: Ryanair Holdings plc vs Avery Dennison Corporation
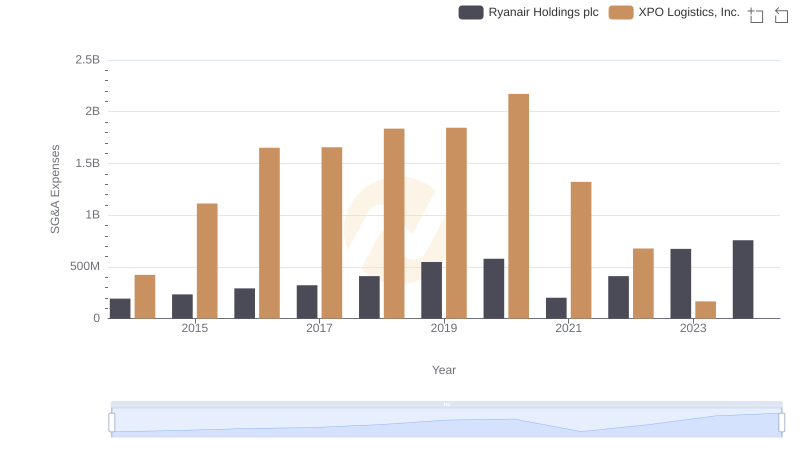
Breaking Down SG&A Expenses: Ryanair Holdings plc vs XPO Logistics, Inc.
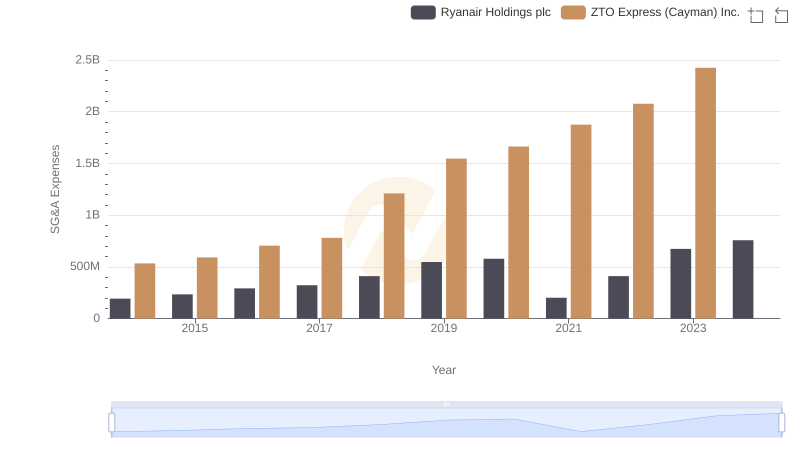
Breaking Down SG&A Expenses: Ryanair Holdings plc vs ZTO Express (Cayman) Inc.
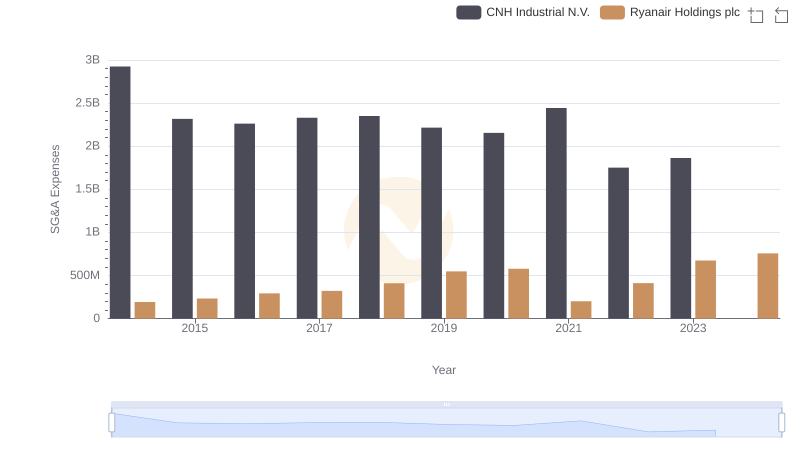
Cost Management Insights: SG&A Expenses for Ryanair Holdings plc and CNH Industrial N.V.
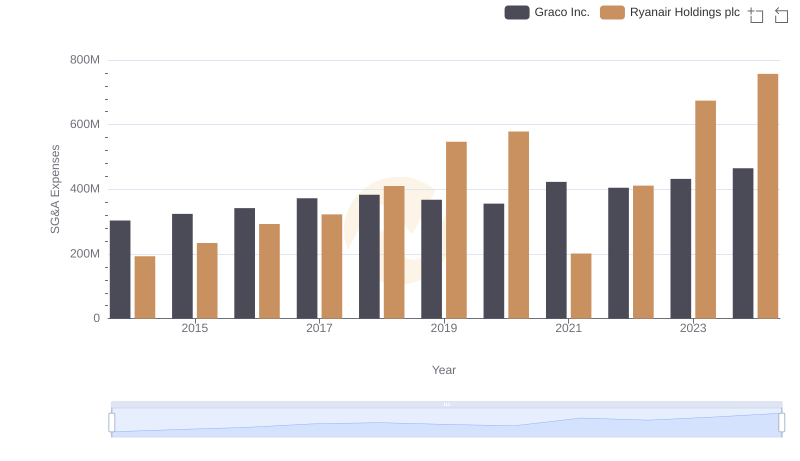
Ryanair Holdings plc and Graco Inc.: SG&A Spending Patterns Compared

Who Optimizes SG&A Costs Better? Ryanair Holdings plc or AECOM
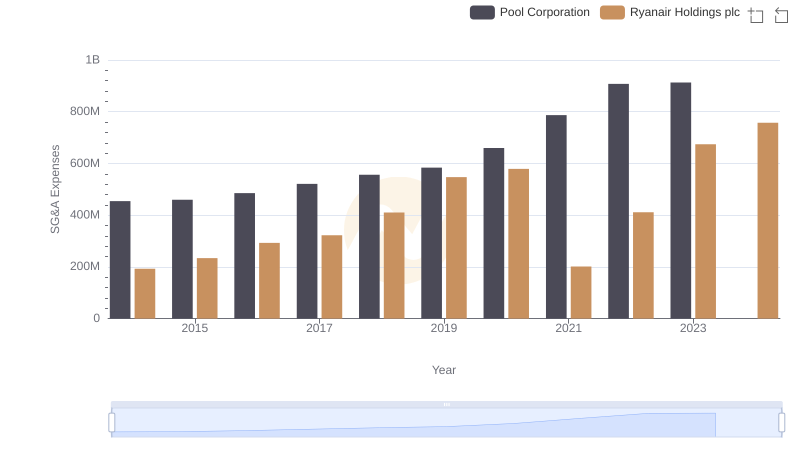
Breaking Down SG&A Expenses: Ryanair Holdings plc vs Pool Corporation
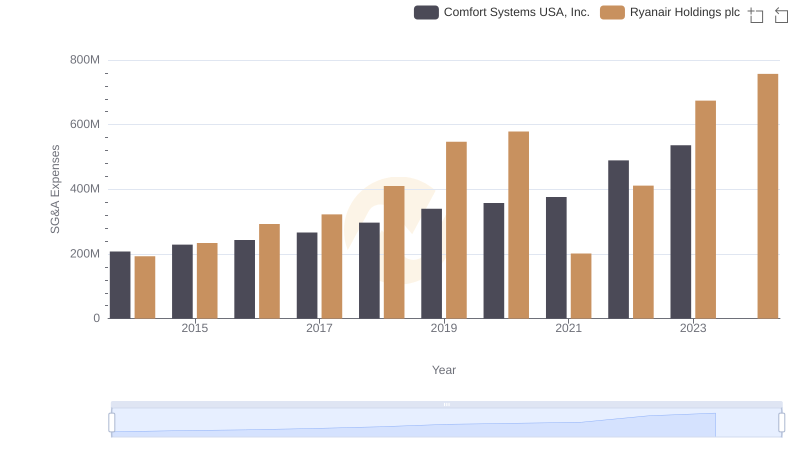
SG&A Efficiency Analysis: Comparing Ryanair Holdings plc and Comfort Systems USA, Inc.
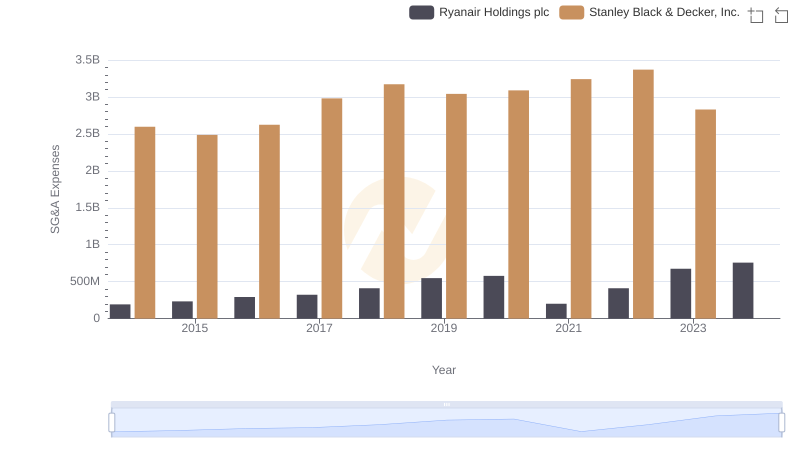
SG&A Efficiency Analysis: Comparing Ryanair Holdings plc and Stanley Black & Decker, Inc.