| __timestamp | Gen Digital Inc. | QUALCOMM Incorporated |
|---|---|---|
| Wednesday, January 1, 2014 | 2880000000 | 2290000000 |
| Thursday, January 1, 2015 | 2702000000 | 2344000000 |
| Friday, January 1, 2016 | 1587000000 | 2385000000 |
| Sunday, January 1, 2017 | 2023000000 | 2658000000 |
| Monday, January 1, 2018 | 2171000000 | 2986000000 |
| Tuesday, January 1, 2019 | 1940000000 | 2195000000 |
| Wednesday, January 1, 2020 | 1069000000 | 2074000000 |
| Friday, January 1, 2021 | 791000000 | 2339000000 |
| Saturday, January 1, 2022 | 1014000000 | 2570000000 |
| Sunday, January 1, 2023 | 968000000 | 2483000000 |
| Monday, January 1, 2024 | 1337000000 | 2759000000 |
Igniting the spark of knowledge
In the ever-evolving landscape of technology, understanding financial trends is crucial. Over the past decade, from 2014 to 2024, QUALCOMM Incorporated and Gen Digital Inc. have showcased distinct trajectories in their Selling, General, and Administrative (SG&A) expenses.
QUALCOMM, a leader in wireless technology, has consistently maintained higher SG&A expenses, peaking in 2018 with a 30% increase from 2014. This reflects its aggressive investment in innovation and market expansion. In contrast, Gen Digital, known for its cybersecurity solutions, experienced a significant 73% drop in SG&A expenses from 2014 to 2021, indicating strategic cost optimization.
Interestingly, both companies show a resurgence in 2024, with QUALCOMM's expenses rising by 11% from 2023, while Gen Digital sees a 38% increase. These trends highlight the dynamic nature of tech industry financial strategies, offering valuable insights for investors and analysts alike.
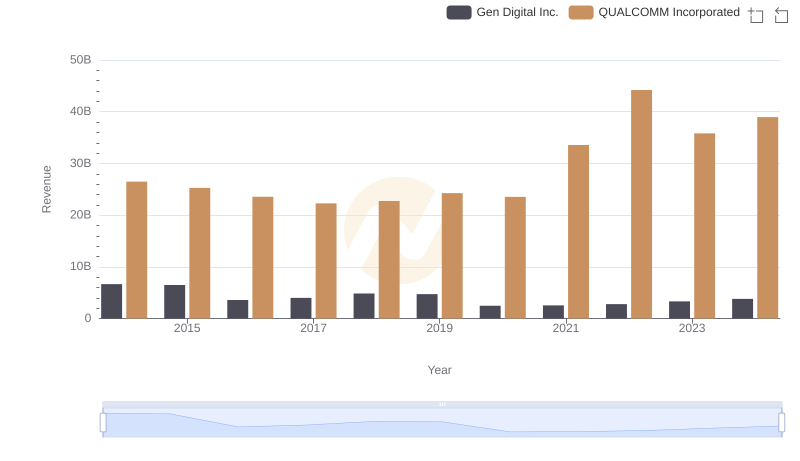
QUALCOMM Incorporated and Gen Digital Inc.: A Comprehensive Revenue Analysis
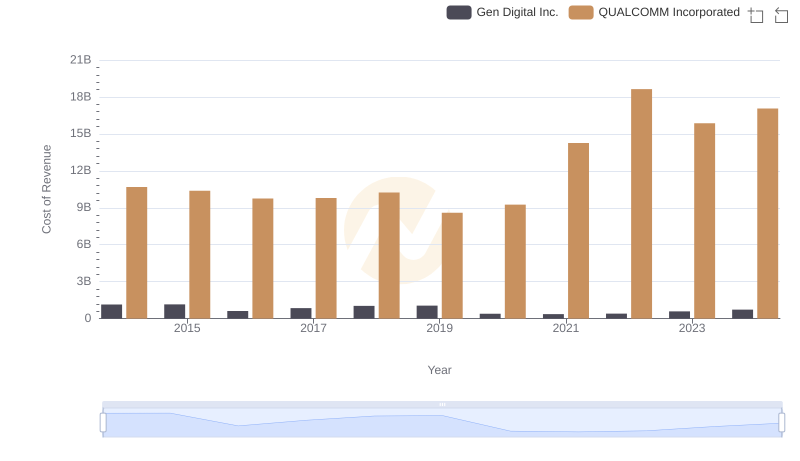
Cost of Revenue Comparison: QUALCOMM Incorporated vs Gen Digital Inc.
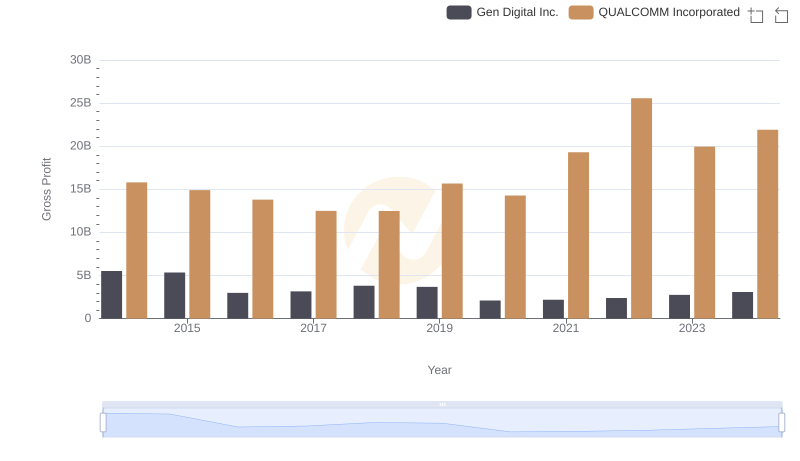
Key Insights on Gross Profit: QUALCOMM Incorporated vs Gen Digital Inc.
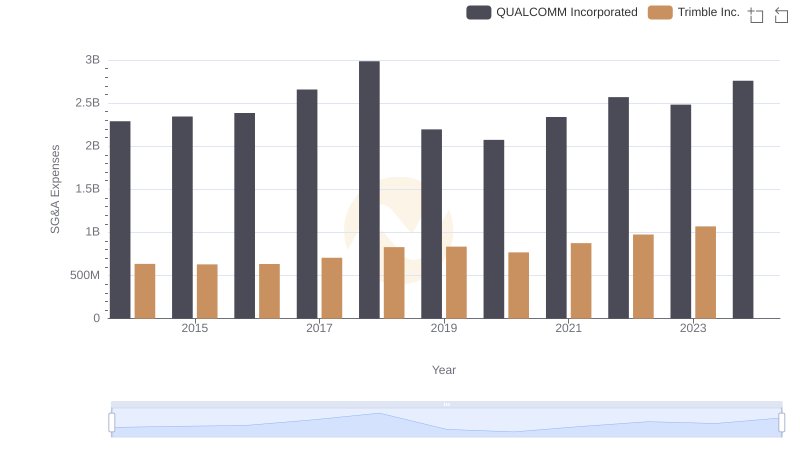
Who Optimizes SG&A Costs Better? QUALCOMM Incorporated or Trimble Inc.
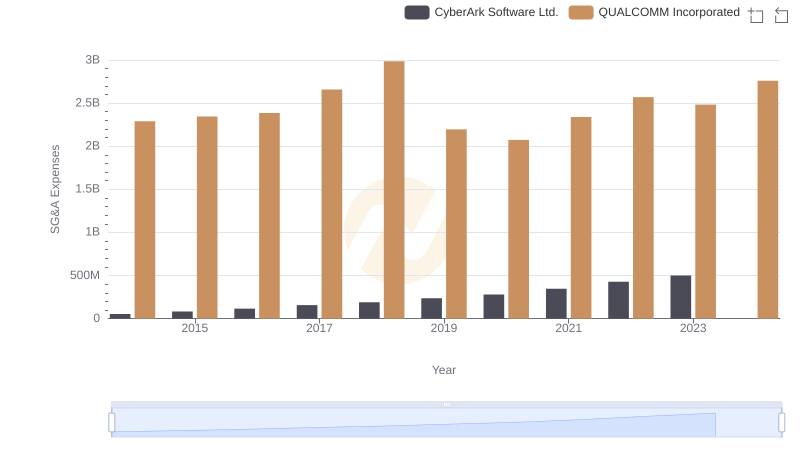
Operational Costs Compared: SG&A Analysis of QUALCOMM Incorporated and CyberArk Software Ltd.
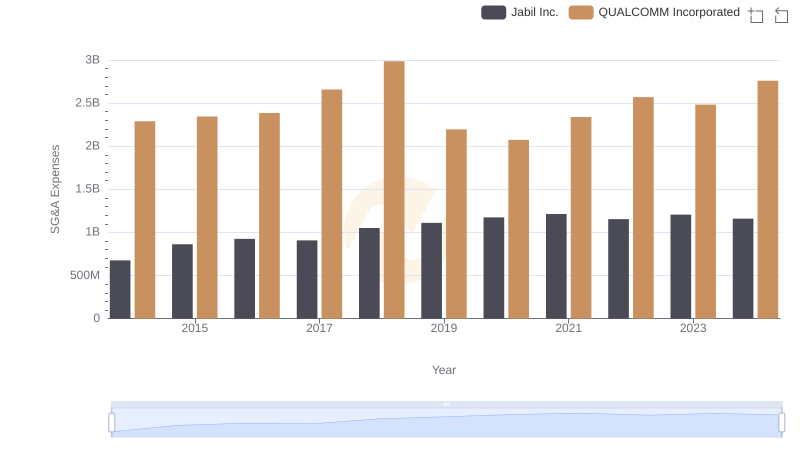
QUALCOMM Incorporated or Jabil Inc.: Who Manages SG&A Costs Better?
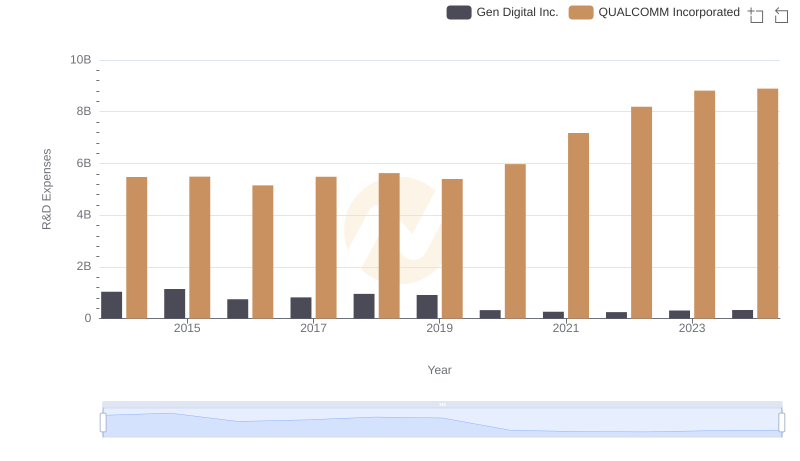
Research and Development Expenses Breakdown: QUALCOMM Incorporated vs Gen Digital Inc.
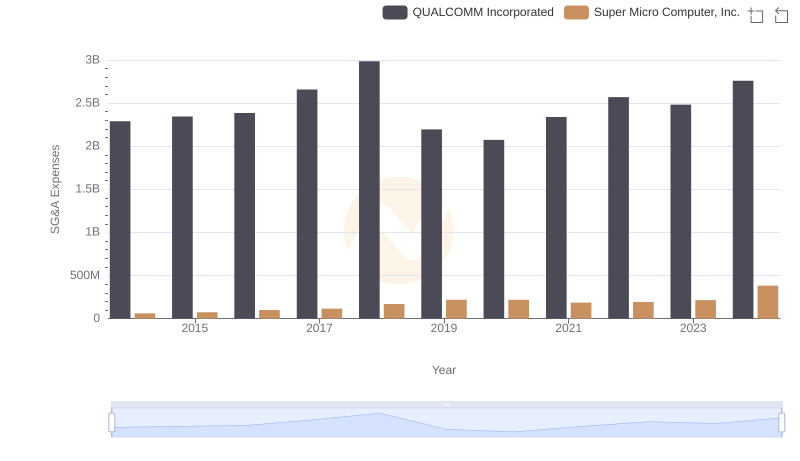
QUALCOMM Incorporated and Super Micro Computer, Inc.: SG&A Spending Patterns Compared
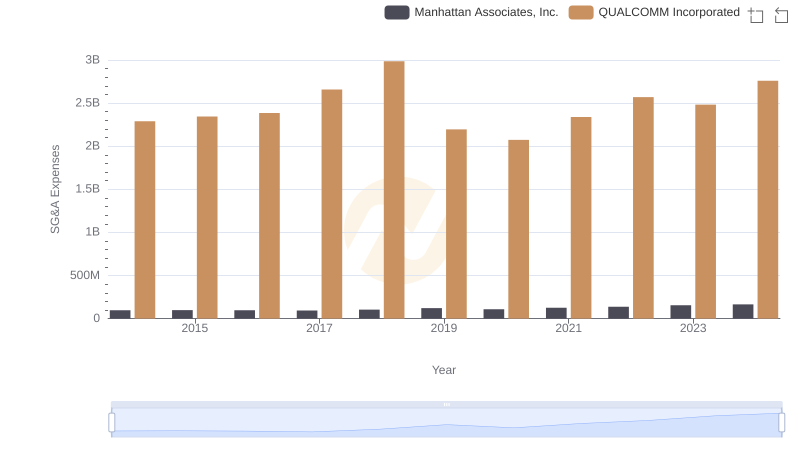
Breaking Down SG&A Expenses: QUALCOMM Incorporated vs Manhattan Associates, Inc.
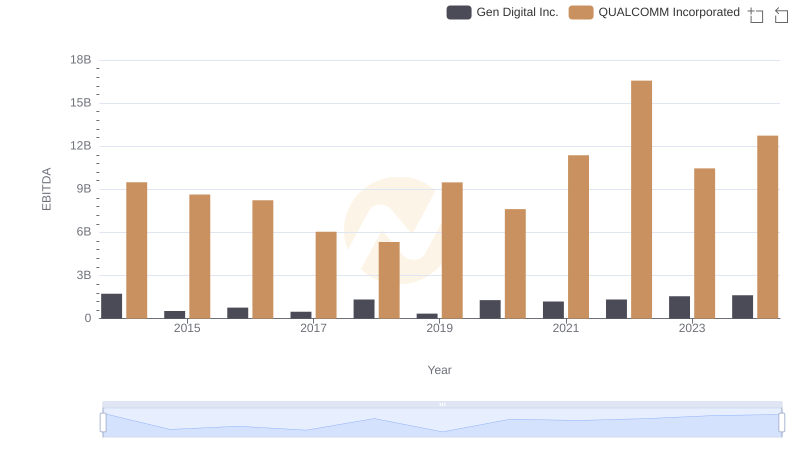
A Professional Review of EBITDA: QUALCOMM Incorporated Compared to Gen Digital Inc.
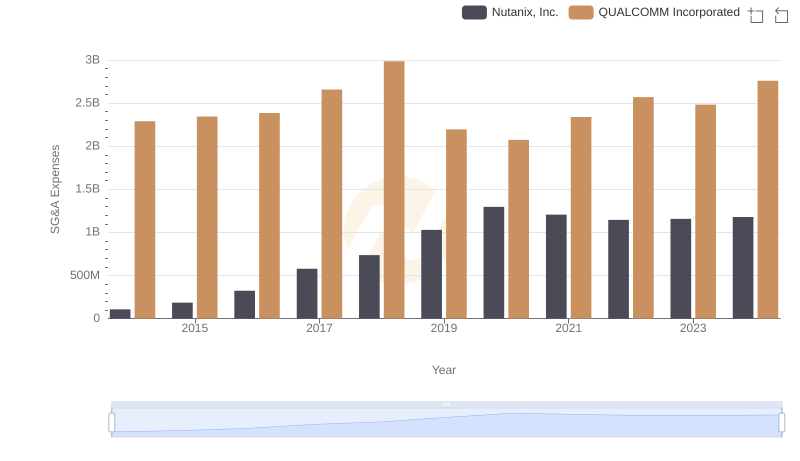
SG&A Efficiency Analysis: Comparing QUALCOMM Incorporated and Nutanix, Inc.
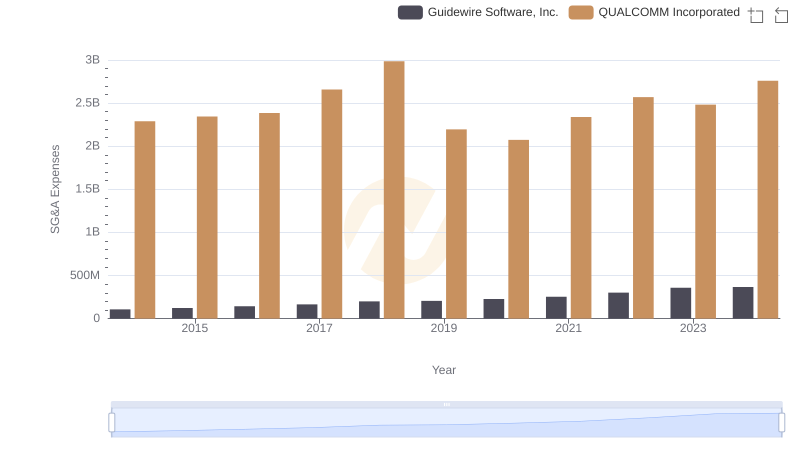
QUALCOMM Incorporated or Guidewire Software, Inc.: Who Manages SG&A Costs Better?