| __timestamp | Gen Digital Inc. | QUALCOMM Incorporated |
|---|---|---|
| Wednesday, January 1, 2014 | 1038000000 | 5477000000 |
| Thursday, January 1, 2015 | 1144000000 | 5490000000 |
| Friday, January 1, 2016 | 748000000 | 5151000000 |
| Sunday, January 1, 2017 | 823000000 | 5485000000 |
| Monday, January 1, 2018 | 957000000 | 5625000000 |
| Tuesday, January 1, 2019 | 913000000 | 5398000000 |
| Wednesday, January 1, 2020 | 328000000 | 5975000000 |
| Friday, January 1, 2021 | 267000000 | 7176000000 |
| Saturday, January 1, 2022 | 253000000 | 8194000000 |
| Sunday, January 1, 2023 | 313000000 | 8818000000 |
| Monday, January 1, 2024 | 332000000 | 8893000000 |
Unlocking the unknown
In the ever-evolving landscape of technology, research and development (R&D) expenses are a critical indicator of a company's commitment to innovation. Over the past decade, QUALCOMM Incorporated and Gen Digital Inc. have demonstrated contrasting approaches to R&D investment.
QUALCOMM has consistently increased its R&D spending, with a notable 62% rise from 2014 to 2023. This upward trend underscores its dedication to maintaining a competitive edge in the semiconductor industry. By 2023, QUALCOMM's R&D expenses reached nearly nine times that of Gen Digital Inc., highlighting its aggressive pursuit of technological advancements.
Conversely, Gen Digital Inc. has experienced a more volatile R&D expenditure pattern, with a significant drop of 75% from its peak in 2015 to 2022. This fluctuation may reflect strategic shifts or market challenges. However, a slight rebound in 2023 suggests a renewed focus on innovation.
These insights into R&D spending provide a window into the strategic priorities of these tech giants, offering valuable lessons for investors and industry observers alike.
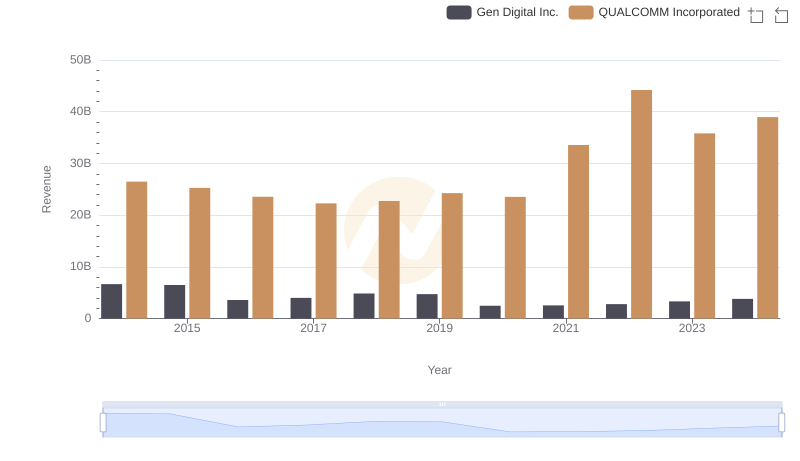
QUALCOMM Incorporated and Gen Digital Inc.: A Comprehensive Revenue Analysis
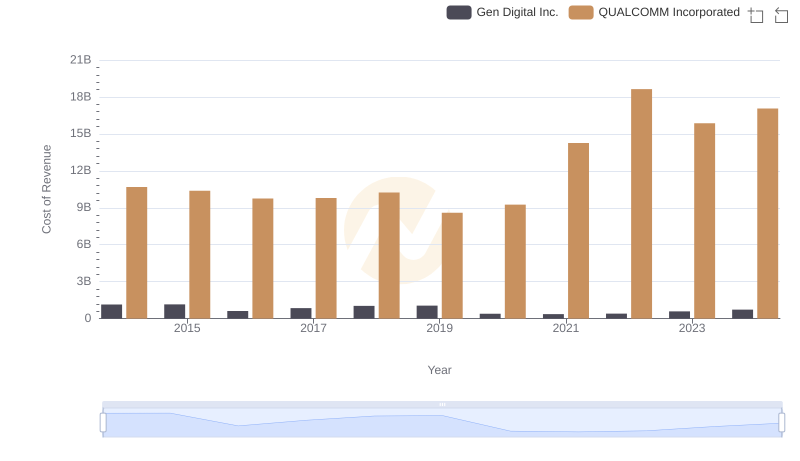
Cost of Revenue Comparison: QUALCOMM Incorporated vs Gen Digital Inc.
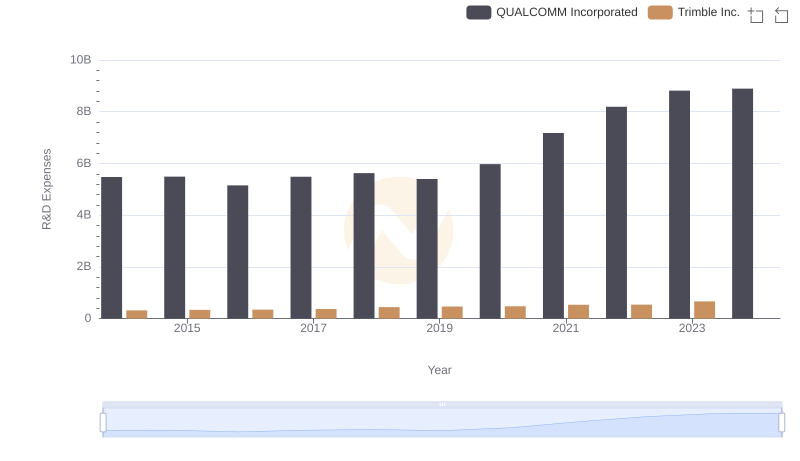
Who Prioritizes Innovation? R&D Spending Compared for QUALCOMM Incorporated and Trimble Inc.
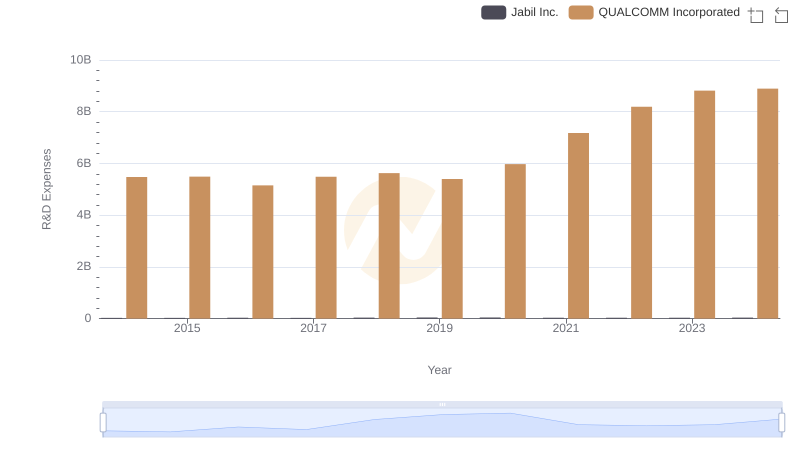
Comparing Innovation Spending: QUALCOMM Incorporated and Jabil Inc.
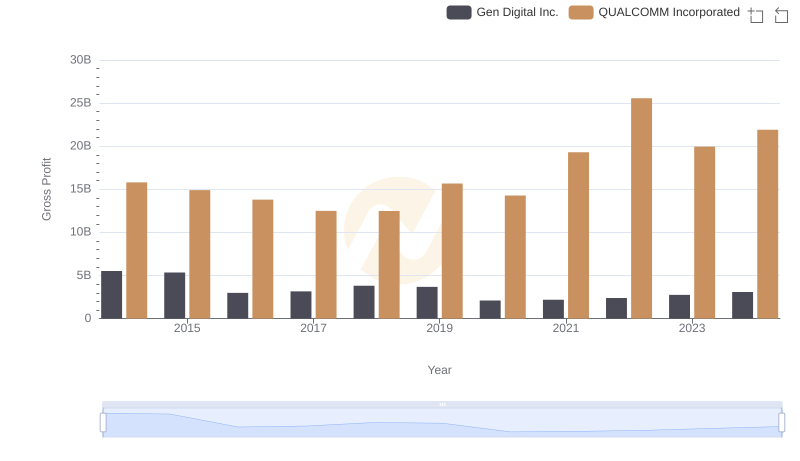
Key Insights on Gross Profit: QUALCOMM Incorporated vs Gen Digital Inc.

Comparing Innovation Spending: QUALCOMM Incorporated and CyberArk Software Ltd.
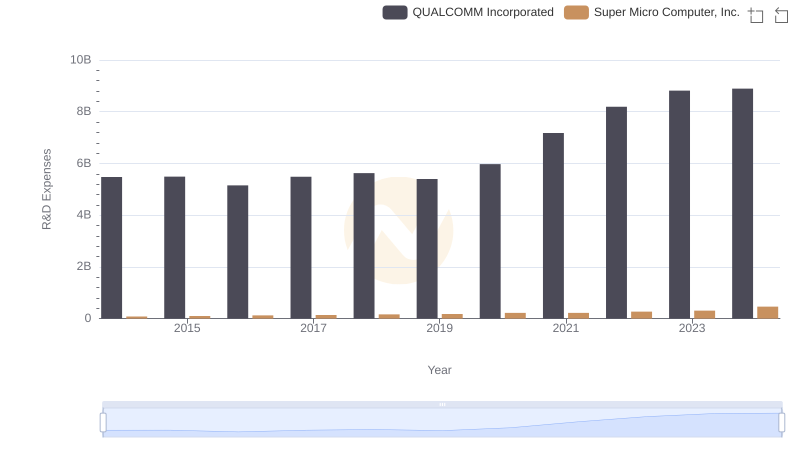
QUALCOMM Incorporated vs Super Micro Computer, Inc.: Strategic Focus on R&D Spending
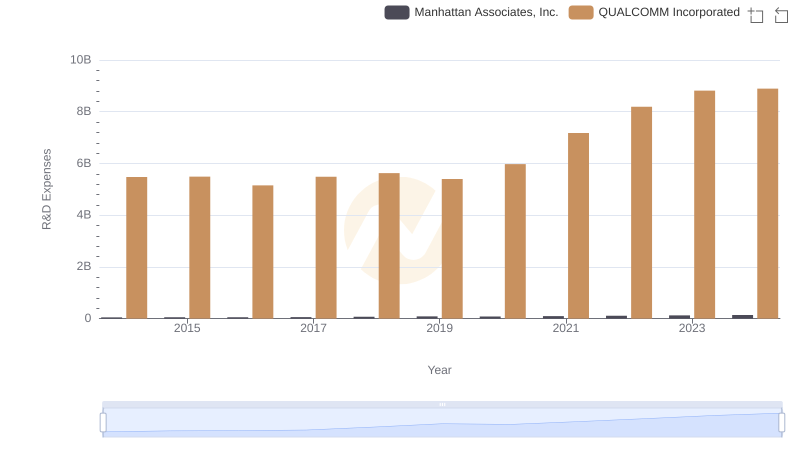
Analyzing R&D Budgets: QUALCOMM Incorporated vs Manhattan Associates, Inc.
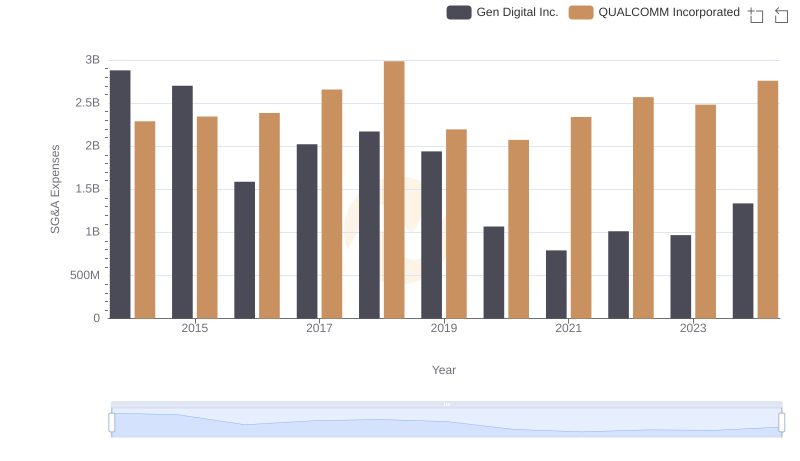
Comparing SG&A Expenses: QUALCOMM Incorporated vs Gen Digital Inc. Trends and Insights
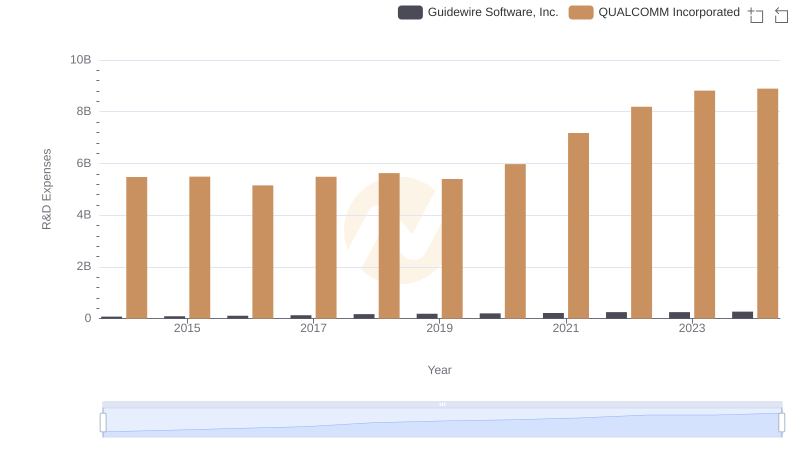
R&D Spending Showdown: QUALCOMM Incorporated vs Guidewire Software, Inc.
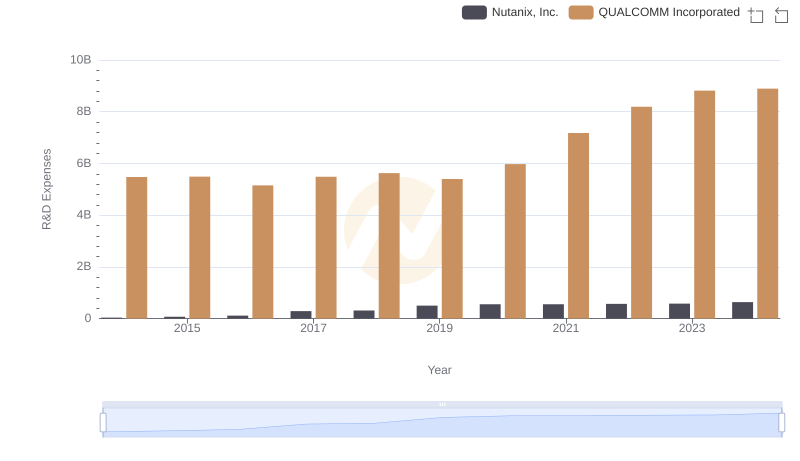
QUALCOMM Incorporated vs Nutanix, Inc.: Strategic Focus on R&D Spending
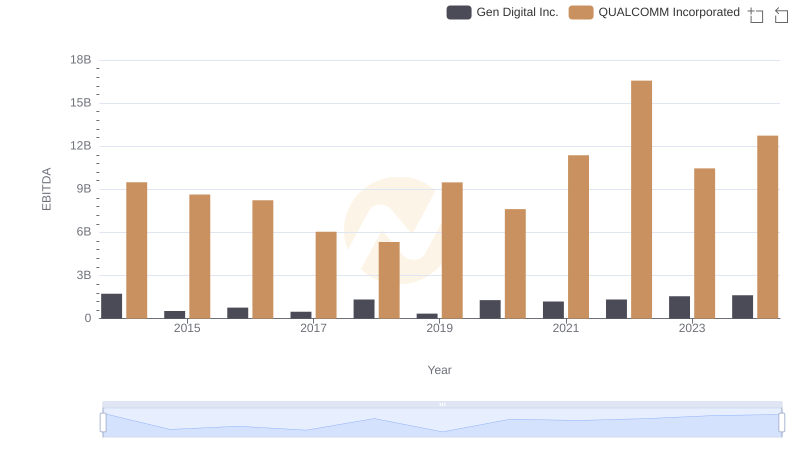
A Professional Review of EBITDA: QUALCOMM Incorporated Compared to Gen Digital Inc.