| __timestamp | QUALCOMM Incorporated | Super Micro Computer, Inc. |
|---|---|---|
| Wednesday, January 1, 2014 | 2290000000 | 61029000 |
| Thursday, January 1, 2015 | 2344000000 | 73228000 |
| Friday, January 1, 2016 | 2385000000 | 100681000 |
| Sunday, January 1, 2017 | 2658000000 | 115331000 |
| Monday, January 1, 2018 | 2986000000 | 170176000 |
| Tuesday, January 1, 2019 | 2195000000 | 218382000 |
| Wednesday, January 1, 2020 | 2074000000 | 219078000 |
| Friday, January 1, 2021 | 2339000000 | 186222000 |
| Saturday, January 1, 2022 | 2570000000 | 192561000 |
| Sunday, January 1, 2023 | 2483000000 | 214610000 |
| Monday, January 1, 2024 | 2759000000 | 383111000 |
Unlocking the unknown
In the ever-evolving tech landscape, understanding the financial strategies of industry leaders is crucial. This analysis delves into the Selling, General, and Administrative (SG&A) expenses of two prominent companies: QUALCOMM Incorporated and Super Micro Computer, Inc., from 2014 to 2024.
QUALCOMM, a titan in wireless technology, consistently allocated substantial resources to SG&A, peaking in 2018 with a 30% increase from 2014. This strategic investment underscores their commitment to maintaining market dominance. In contrast, Super Micro Computer, Inc., a leader in high-performance computing, exhibited a remarkable 528% surge in SG&A expenses over the same period, reflecting their aggressive expansion and market penetration efforts.
By 2024, Super Micro's SG&A spending reached 383 million, a testament to their rapid growth trajectory. This comparative analysis highlights the diverse financial strategies employed by these tech giants, offering valuable insights into their operational priorities.
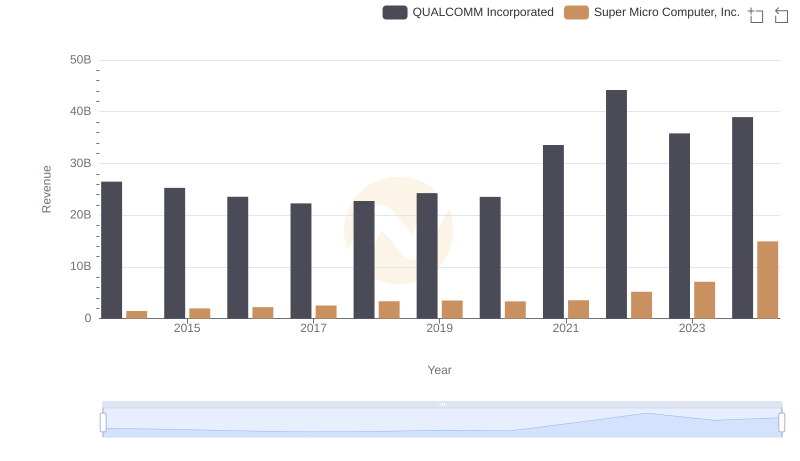
Revenue Insights: QUALCOMM Incorporated and Super Micro Computer, Inc. Performance Compared
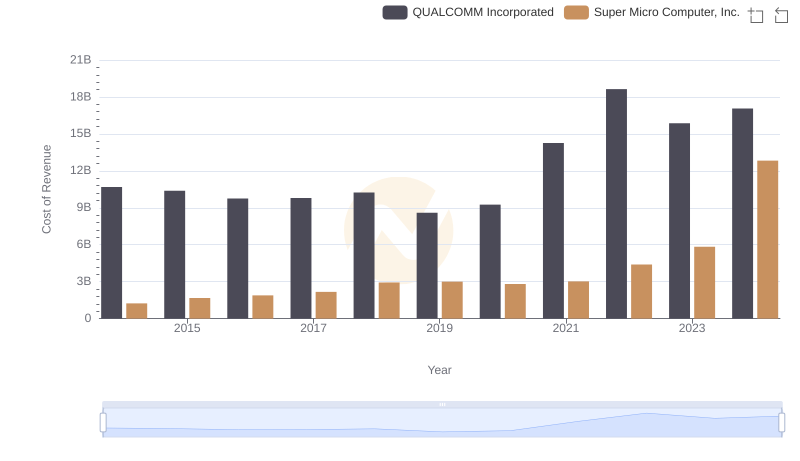
Cost of Revenue: Key Insights for QUALCOMM Incorporated and Super Micro Computer, Inc.
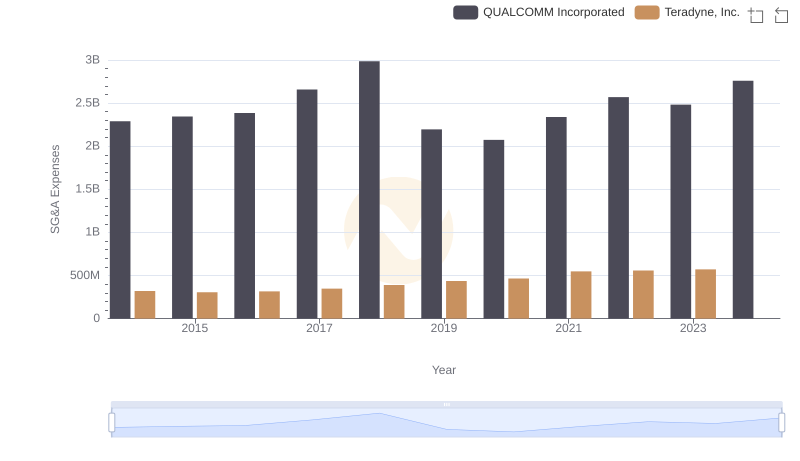
Selling, General, and Administrative Costs: QUALCOMM Incorporated vs Teradyne, Inc.
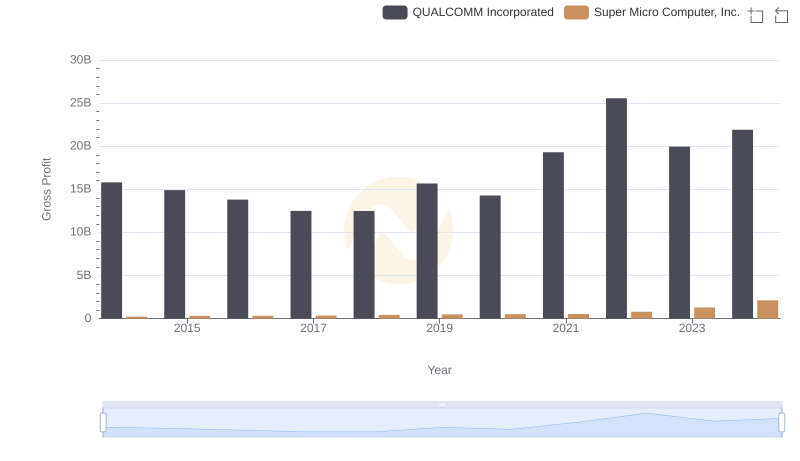
Gross Profit Trends Compared: QUALCOMM Incorporated vs Super Micro Computer, Inc.
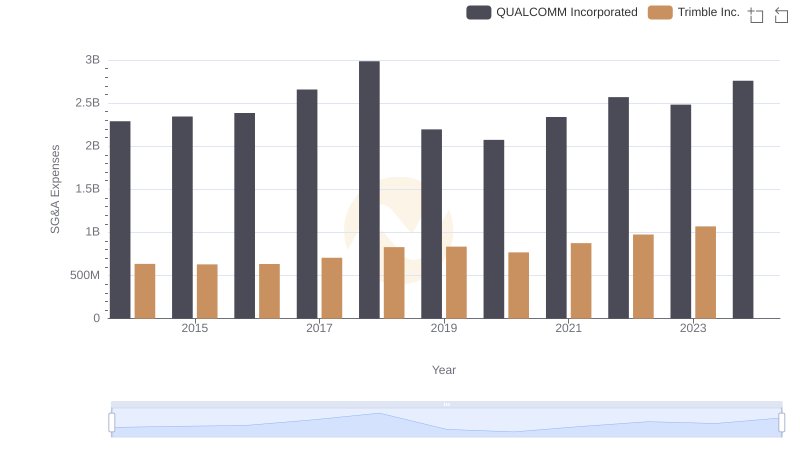
Who Optimizes SG&A Costs Better? QUALCOMM Incorporated or Trimble Inc.
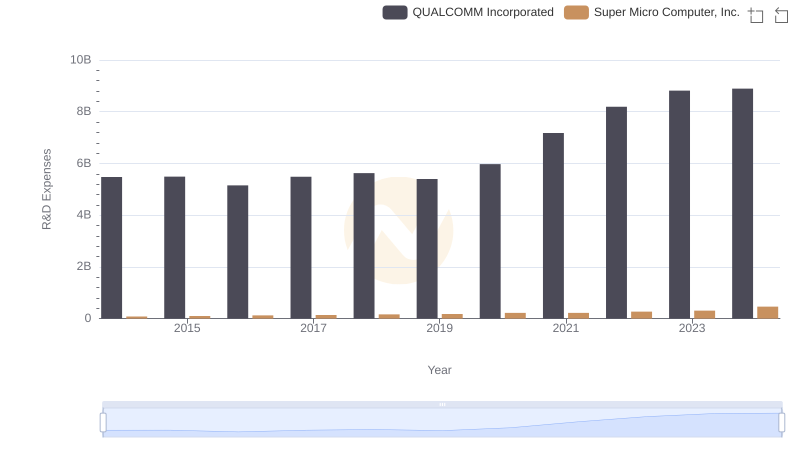
QUALCOMM Incorporated vs Super Micro Computer, Inc.: Strategic Focus on R&D Spending
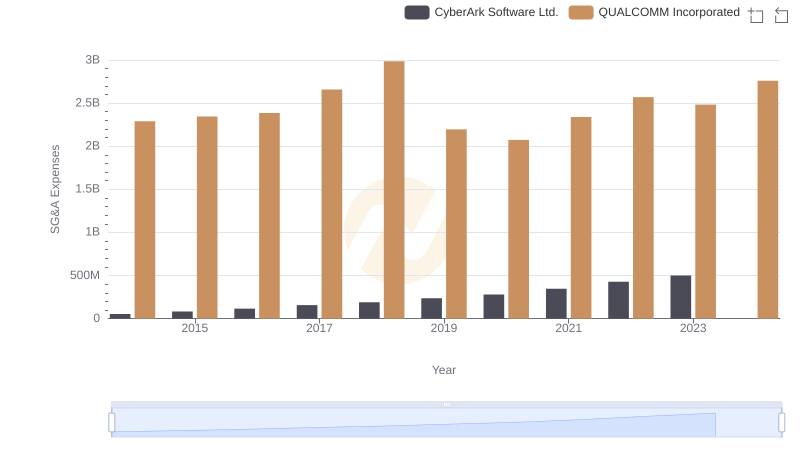
Operational Costs Compared: SG&A Analysis of QUALCOMM Incorporated and CyberArk Software Ltd.
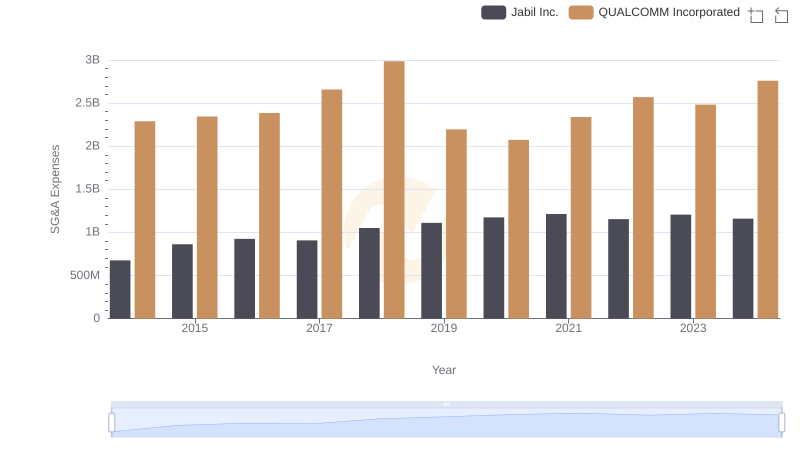
QUALCOMM Incorporated or Jabil Inc.: Who Manages SG&A Costs Better?
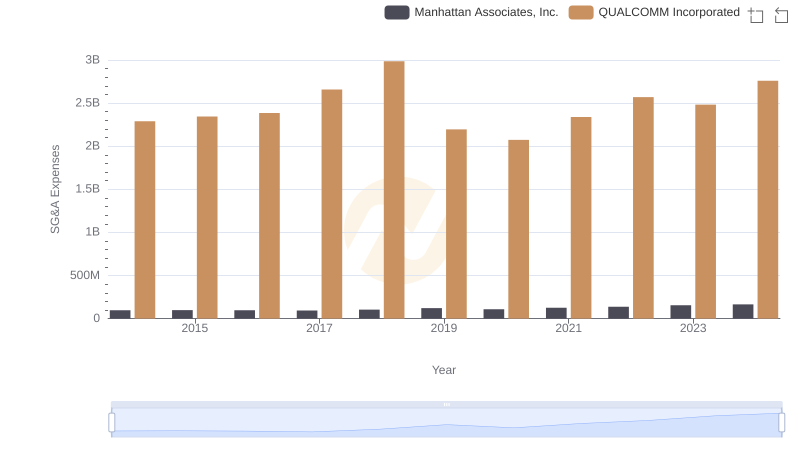
Breaking Down SG&A Expenses: QUALCOMM Incorporated vs Manhattan Associates, Inc.
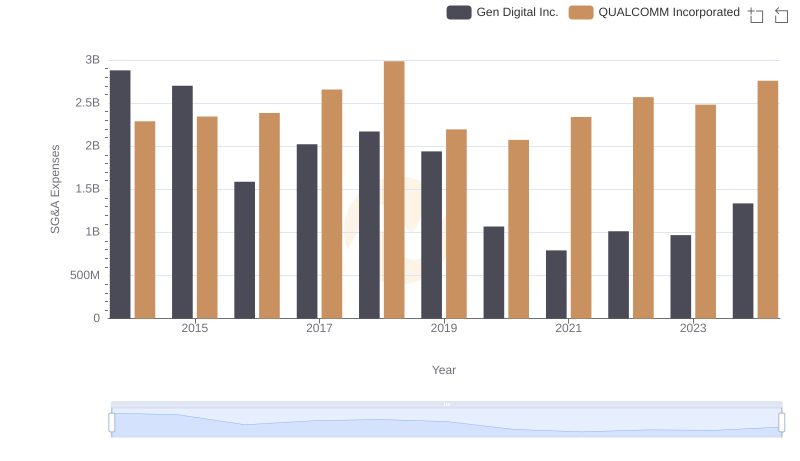
Comparing SG&A Expenses: QUALCOMM Incorporated vs Gen Digital Inc. Trends and Insights
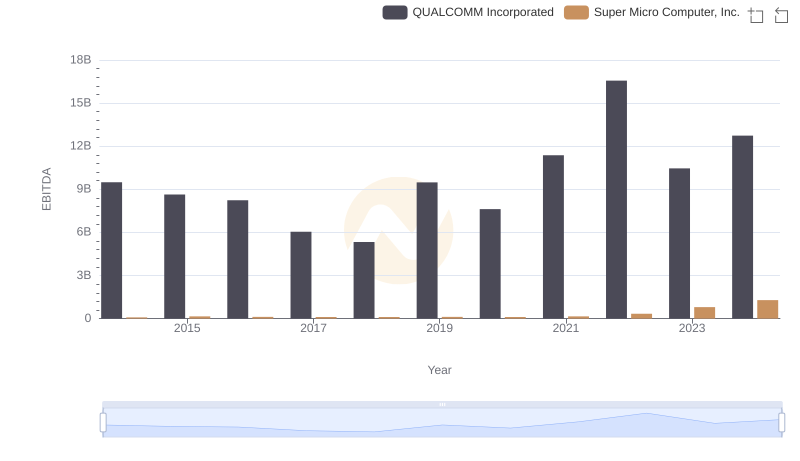
Comparative EBITDA Analysis: QUALCOMM Incorporated vs Super Micro Computer, Inc.
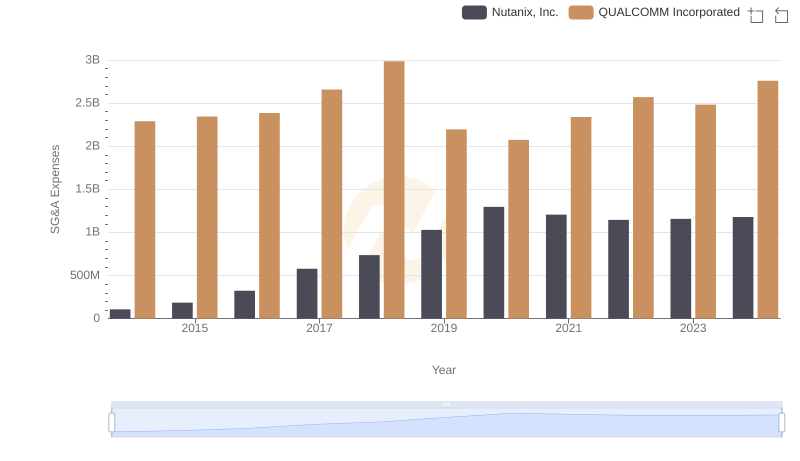
SG&A Efficiency Analysis: Comparing QUALCOMM Incorporated and Nutanix, Inc.